Curated OER
Unit II: Worksheet 1 - Velocity
Beginning physics scholars interpret two graphs depicting position versus time. For each graph, there is a series of questions to answer. The exercise is basic, but beneficial. Consider using it as an assessment of understanding after...
Space Awareness
The Climate in Numbers and Graphs
Weather versus climate: weather relates to short time periods while climate averages the weather of a period of many years. Scholars learn about average temperature and precipitation in various climate zones and then apply statistics...
Willow Tree
Histograms and Venn Diagrams
There are many different options for graphing data, which can be overwhelming even for experienced mathematcians. This time, the focus is on histograms and Venn diagrams that highlight the frequency of a range of data and overlap of...
Curated OER
Circle Graphs
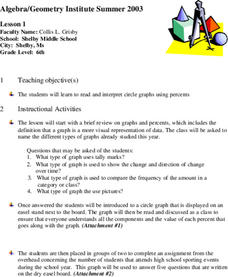
Sixth graders participate in a lesson that covers the reading and interpretation of a circle graph. They review the part of a whole concept for percents and student observe and practice using the circle graph.
Curated OER
Problem-Solving Application: Use a Graph: Practice
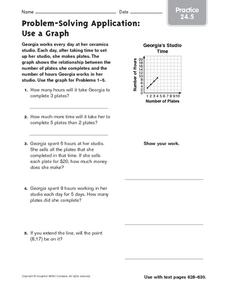
In this graphing coordinates instructional activity, students study the graph and the coordinates. Students then answer the five questions about the graph and show their work.
Columbus City Schools
To Measure its Mass or Volume?
Atoms, elements, and molecules, oh my! Teaching the fundamentals of chemistry to curious sixth graders has never been easier to accomplish. Here is a resource that pulls together everything needed to get them off to a good start,...
Curated OER
Linear Motion 6
In this linear motion worksheet, students answer 12 questions about acceleration, velocity and distance traveled. They interpret diagrams and indicate the location of an object if it has positive, negative or no acceleration. They...
Curated OER
Cutting Expenses
Students explore budgeting. For this finance and math lesson, students brainstorm ways in which households could save money. Students view websites that give cost reducing ideas. Students complete an expense comparison chart and use the...
Curated OER
Speed
Fifth and sixth graders practice working in pairs to determine whether they can walk with constant speed. They test themselves, collect their data, draw graphs with their data collected, manipulate the data, and then draw conclusions...
Curated OER
Matrix Analysis of Networks
Explore the connection between a finite graph, a directed graph, and a matrix. Graph lines and identify the relationship of matrices in real-world scenarios. Then use this information to work with a partner to plan and design a...
Curated OER
Show Me The Data!
Pupils create a bar graph. They will collect and organize data to turn into bar graphs. They create graphs for the favorite sports of the class, color of M&M's, and types of cars passing by.
Curated OER
Busted Bubbles
Using the scientific method, and bubble gum, learners conduct a motivating experiment. After conducting a series of tests involving bubble gum, they graph and analyze their results. This is the type of activity everyone loves.
Curated OER
Buses
Busy buses bustling back and forth. In this middle school assessment task, learners use information given in a graph to answer questions about bus schedules. They then determine how many times a bus passes by other buses going in the...
Curated OER
Walk-A-Thon
Students graph linear http://www.lessonplanet.com/review?id=180542equations. In this problem solving lesson, students calculate slope and plot ordered pairs on a coordinate grid. Using a real-life example of a walk-a-thon, students...
Curated OER
A Day at the Beach
Help learners determine the rate of change for the temperature of sand. They will collect data on the temperature of wet and dry sand over time with a heat lamp overhead. Then make a scatter plot of the data and find a linear model to...
Curated OER
Environmental Agents of Mathematics: Mathematics for Change
High schoolers analyze environmental science data using Math. They do research about renewable energy, gather data, create graphs and interpret their findings. Then the group presents their arguments persuasively using their findings to...
Curated OER
Exploring Slope and Intercept
For this slope and intercept worksheet, students complete 23 problems involving sketching graphs, interpreting graphs, and interpreting slope.
Curated OER
Velocity
In this velocity worksheet, students solve 13 problems including finding acceleration of objects, forces on objects, velocity of objects and interpreting graphs of position vs. time.
Curated OER
Real Life Graphs
In this real life graphs worksheet, students examine graphs and determine the equation of a line. They interpret distance time graphs and draw graphs to match a real life situations. This three-page worksheet contains 3 multi-step problems.
Bowland
Problem Page
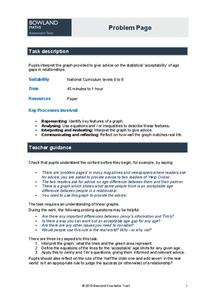
Future mathematicians use a given graph to answer a question about age differences in relationships. Along the way, they must find the equation and inequality of given graphs.
Inside Mathematics
Squares and Circles
It's all about lines when going around. Pupils graph the relationship between the length of a side of a square and its perimeter. Class members explain the origin in context of the side length and perimeter. They compare the graph to the...
EngageNY
Graphs of Exponential Functions
What does an exponential pattern look like in real life? After viewing a video of the population growth of bacteria, learners use the real-life scenario to collect data and graph the result. Their conclusion should be a new type of...
EngageNY
Graphs of Piecewise Linear Functions
Everybody loves video day! Grab your class's attention with this well-designed and engaging resource about graphing. The video introduces a scenario that will be graphed with a piecewise function, then makes a connection to domain...
Curated OER
Graphing Linear Equations on the TI-73
Eighth graders work in pairs with a TI-73 graphing calculator to complete a multiple-choice review using the Classroom Performance System. Each team uses a remote unit to "click in" the answers. When all teams have completed the review,...


