Curated OER
Virtual Field Trip
Students calculate gasoline cost per mile on a virtual field trip. They calculate the gasoline costs and travel time for each of the 2 routes, and record on a data sheet. They use Excel to create data tables for mileage, gasoline...
Curated OER
Science: Trouble in the Troposphere
Students research a NASA Website and record information about an assigned city's tropospheric ozone residual monthly climate. In groups, they graph the information for the past year. They form new groups and compare their city's...
Curated OER
Stock It To Me
Young scholars investigate the stock market using stock market tables, charts, and graphs. They participate in a simulation of stock market investment over time. They read about the history of Wall Street and the Stock Market.
Curated OER
Rolling Dice
Fourth graders investigate the mathematical concept of probability. They determine the given mean of a data set found when rolling dice. The results of the experiment are displayed using a bar graph. The teacher does an example before...
Curated OER
What's up with the weather?
Students use the weather as a context for collecting data and making interpretations based upon the observations. The scientific method is also taught to give them a way to conduct the data collection.
Curated OER
Welcome to Populations!
Students define what population is in their own words. In this biology instructional activity, students explain different ways to measure population density. They interpret population graphs.
Curated OER
Using an Amortization Table
Students search the Internet to find a site that contains an amortization table and make a hypothesis about the results of changing time and rate. They examine the affects of time and rate on a mortgage and discuss the difference in the...
Curated OER
Routing Explorers
Students read excerpts from an explorer's journal and then become investigators and navigators themselves. Students answer questions about the difficulties and time it took for the explorers to travel from Washington to New Orleans and...
Curated OER
Calculating Range for a Constant Velocity
Students read an explanation from the NASA Web-based "textbook", The Beginner's Guide to Aerodynamics, then use the information in combination with data from other Web sites to solve single variable equations for distance (range), time,...
Curated OER
Chinese immigrants in British Columbia, 1870
Students create graphs and tables on the number of Chinese in British Columbia according to 1870 Census data. They analyze the data and complete worksheets in small groups and then discuss their conclusions as a class.
Curated OER
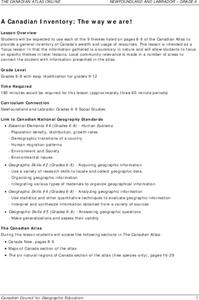
A Canadian Inventory: The Way We Are!
Learners use the Canadian Atlas to discover an inventory of Canada's wealth and usage of resources. Using charts and graphs, they produce a wall of selected data of importance to the country and identify one issue of sustainability. ...
Curated OER
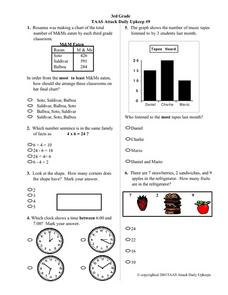
3rd Grade TAAS Attack Daily Upkeep #9
In this math literacy worksheet, 4th graders practice interpreting the pictographs in order to assemble the information to find the solutions to the 13 problems.
Curated OER
Applying Properties to Variables
Eighth graders combine like terms in this properties of variables lesson. Using named items (stars, moons and hearts), they combine like terms using variables. They use the distributive property to combine like terms. Finally, they write...
Curated OER
A Walk in the Woods: The Legacy of the Haudenosaunee
Fourth graders explore folktales and legends to investigate the life and culture of the Haudenosaunee Indians. The stories and food of the six Nations are experienced as the lesson proceeds.
Curated OER
Artifact Bingo
Seventh graders participate in an artifact bingo game. Before beginning, they label the coordinates of a grid correctly along with symbols. They use the grid to place artifacts in their correct coordinates. They use primary source...
Kenan Fellows
Math Made Simple as 1-2-3: Simplified Educational Approach to Algebra
Writing an equation of a line is as easy as m and b. A lesson presentation gives individuals different strategies for writing equations of lines. Some items provide a slope and a point while others provide two points. Whatever the given,...
Population Connection
The Peopling of Our Planet
How many people live on the planet, anyway? The first resource in a six-part series covers the topic of the world population. Scholars work in groups to conduct research and make population posters after learning about the global...
Teach Engineering
Creepy Silly Putty
It might be silly to determine the creep rate of putty but groups will enjoy making different formulations of silly putty and playing with them to understand how the different mixtures behave. The second part of the activity has groups...
Curated OER
Mathematics Within: Bar And Pie Graphs
Students compare and contrast the use of bar and pie graphs with the same data. They create a data set by surveying all students in the class using sticky notes to make a table on the board. Then, each student creates a bar and pie graph...
Curated OER
Order of Operations
Ninth graders investigate the order of operations. In this Algebra I lesson plan, 9th graders explore the rules of arithmetic and algebra as they review and practice simplifying increasingly complex numeric expressions using the...
Alabama Learning Exchange
Energy and Work Amusement Park Style
Students distinguish between kinetic and potential energy. They recognize that energy can change from one form to other forms. They identify and describe several forms of energy.
Curated OER
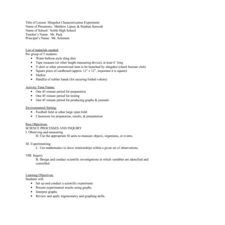
Slingshot Characterization Experiment
Students set up and conduct a scientific experiment to demonstrate data collection. In this scientific process lesson, students complete an activity with the specific objective of using a slingshot to fire a t-shirt into the crowd at a...
Curated OER
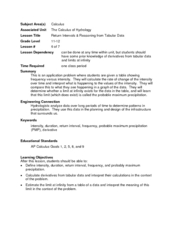
Return Intervals & Reasoning from Tabular Data
Young scholars calculate derivatives from a set of data. In this calculus lesson, students estimate the limit at infinity. They complete a Return Interval handout at the end of the lesson.
Curated OER
Hey, Pythagoras! Help Me Understand Your Theorem!
Learners explore the Pythagorean Theorem. In this math lesson, pupils solve problems using the Pythagorean Theorem. They select the appropriate numbers to substitute in the formula to solve problems.


