Curated OER
Twelve Days of Christmas--Prediction, Estimation, Addition, Table and Chart
Scholars explore graphing. They will listen to and sing "The Twelve Days of Christmas" and estimate how many gifts were mentioned in the song. Then complete a data chart representing each gift given in the song. They also construct...
Curated OER
Organizing and Interpreting Data
In this organizing and interpreting data worksheet, students solve and complete 10 different problems related to reading various data tables. First, they complete the 3 charts shown with the correct tally amount, frequency amount, and...
Curated OER
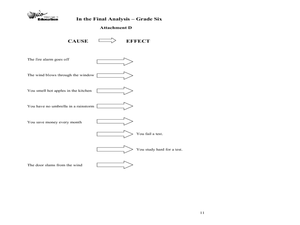
The Final Analysis: Cause and Effect, Fact and Opinion
Middle schoolers read and review informational texts, analyze cause and effect, and distinguish fact from opinion. They assess a "one-minute mystery" you read aloud for cause and effect relationships. Resource includes complete set of...
Curated OER
Probability With a Random Drawing
Students define probability, and predict, record, and discuss outcomes from a random drawing, then identify most likely and least likely outcomes. They conduct a random drawing, record the data on a data chart, analyze the data, and...
Curated OER
Analyzing Health
Third graders analyze their health. In this analysis lesson plan, 3rd graders rate their health on a 1-10 scale. They then tally the scores from the class and create a data chart. Then they answer true and false questions based on...
Curated OER
Mathematics of Fair Games
Pupils study about mathematicians' notion of fairness in games of chance. They work in pairs to perform three different experiments using macaroni and paper bags. They record their results on charts and discuss the fairness of the games.
Curated OER
Favorite Survey
Fourth graders collect and organize data for charts and bar graphs by questioning their classmates. They utilize a worksheet imbedded in this plan which guides them through their 'favorites' survey.
Curated OER
Getting To School: Loving It Or Loathe It?
Pupils engage in a study looking at the problem of transportation to school. They conduct research using a variety of resources. The information is used in order to work together to come up with possible solutions based upon current...
Curated OER
Foods and Languages of the World
Students review Mexico's location and language and learn to pronouns 10 new Spanish food words. Students listen as the book, Corn is Maize is read, touching and passing around an ear of Indian corn. Students discuss the contribution of...
Curated OER
The Gathering and Analysis of Data
Young mathematicians gather data on a topic, graph it in various forms, interpret the information, and write a summary of the data. They present their data and graphs to the class.
Curated OER
Recording Frequency
First graders analyze nursery rhymes and gather data about word frequency. In this frequency lesson, 1st graders create graphs and tables. Students interpret the data.
Curated OER
Literacy Activity: Mouse Shapes
Students listen to the book Mouse Shapes and identify the shapes in the book as it is being read. In this shapes lesson, students identify the shapes in the book, and then play with cut out shapes that they can hold in their hands.
Curated OER
All About Graphs
Students practice organizing data by creating graphs. For this statistics lesson, students survey the class about favorite colors and create a bar graph using the data. Students complete a test based on pet and animal statistics.
Curated OER
Observing and Sketching the Lunar Surface
Learners explore space science by conducting an illustration activity. In this lunar instructional activity, students discuss what the moon is and the role it plays for our environment on Earth. Learners view images of the moon and...
Curated OER
Gathering, Recording, and Presenting Data
Sixth graders use the local newspaper to find and discuss examples of uses of statistics and the ways in which the information is presented. They create and represent their own set of data showing how students get to school each day.
Curated OER
Graphing Family Reading Habits
Second graders collect data from their families about their reading habits and graph them. For this graphing family reading habits lesson, 2nd graders interview family members about their reading habits. They then use a graphing computer...
Curated OER
Cinderbank
Fourth graders identify major components of a "Cinderella" story in order to create a database.
Other popular searches
- Tally Charts and Pictographs
- Tally Charts and Tables
- Tally Charts or Pictographs.
- Math Tally Charts
- Primary Tally Charts
- Sorting and Tally Charts
- Tally Charts Mode
- Using Tally Charts
- Lucky Charms Tally Charts
- Birthday Tally Charts
- Tally Charts Lesson Plans
- Halloween Candy Tally Charts


