Edmond Public Schools
8th Grade Science Resource Book: Unit 2 - Physics
Get things moving with this extensive collection of physical science resources. Covering the fundamentals of measurement, graphing, lab safety, and experimental design as well as the specific scientific concepts...
Curated OER
M&M Science and Math
A series of math and science activities feature M&M's® as manipulatives to help kids work through equations. The resource includes exercises on finding averages, percent of compositions, moles in chemical reactions, genotypes and...
Curated OER
Frequency Tables - Home Link Support
In this home school support worksheet, 2nd graders, with a home support person, review the use of frequency tables to organize and display data. They make their own frequency table and read it with the support person.
Shodor Education Foundation
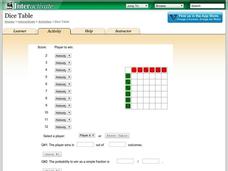
Dice Table
Convert a table to probabilities. Pupils set up the winning rules for the sums of two dice. Using the rules, the applet fills out a table showing the winners for each combination. Learners determine the probabilities of winning for each...
Curated OER
Fish Communities in the Hudson
Learning to read data tables is an important skill. Use this resource for your third, fourth, or fifth graders. Learners will will study tables of fish collection data to draw conclusions. The data is based on fish environments in the...
Curated OER
Times Tables - Multiplication
Introduce students to multiplication through this fantastic math worksheet. Provides beginners with an explanation of multiplication as repeated addition using pictures to help students visualize the meaning and process of multiplying....
Curated OER
Now That's Using Your Head!
Explore linear measurement. Scholars will measure the circumference of their head and the distance they can jump. Information is recorded, averages are calculated, and a data table is completed. They then determine possible relationships...
Curated OER
Survey of Height
In this data collection instructional activity, students survey the heights of their fellow classmates, organize their data in a data table, and create a bar graph from their data. Once bar graph is completed, students complete 2 short...
Math Worksheets Land
Patterns of Association (Using Data Tables) - Independent Practice Worksheet
Here is a worksheet that belongs in a four-part resource that has learners practice using data tables to calculate percentages. The page has ten problems with different data tables asking to find different...
Curated OER
Ornithology and Real World Science
Double click that mouse because you just found an amazing lesson plan! This cross-curricular Ornithology lesson plan incorporates literature, writing, reading informational text, data collection, scientific inquiry, Internet research,...
Curated OER
Creating a Thematic Map
Students create and analyze a weather-related data table and a thematic map based upon information provided.
Curated OER
Are You Full of Hot Air?
Explore the concept of measuring and recording circumference. In this physical science and measurement lesson, young learners blow up balloons, measure the circumference, and record the data on an interactive graphing website.
Curated OER
Environmental Agents of Mathematics: Mathematics for Change
High schoolers analyze environmental science data using Math. They do research about renewable energy, gather data, create graphs and interpret their findings. Then the group presents their arguments persuasively using their findings to...
Curated OER
Data Displays with Excel
Students collect and analyze data. In this statistics lesson, students display their data using excel. They plot the data on a coordinate plane and draw conclusion from their data.
Curated OER
Reading Frequency Tables
In this data interpretation worksheet, learners record the data from 10 examples into frequency tables. They group 10 more data sets, and make a frequency table for each.
Achieve
False Positives
The test may say you have cancer, but sometimes the test is wrong. The provided task asks learners to analyze cancer statistics for a fictitious town. Given the rate of false positives, they interpret the meaning of this value in the...
Noyce Foundation
Ducklings
The class gets their mean and median all in a row with an assessment task that uses a population of ducklings to work with data displays and measures of central tendency. Pupils create a frequency chart and calculate the mean and median....
Buffalo-Hanover Montrose Schools
Histogram Worksheet
Young mathematicians analyze a given set of numbers to complete a frequency table, and then make a histogram using the data. The worksheet includes three sets of data on the worksheet.
National Nanotechnology Infrastructure Network
Learning About Surface Area and Volume
Plan a dinner party. Using a book by Marilyn Burns as a context, pupils learn about the relationships between area and perimeter and surface area and volume. The hands-on activities have learners rearrange tables and cut up meatballs to...
Curated OER
Seven Rates and Ratio Problems Using Tables
In this rates and ratios activity, students complete tables given rates. This activity contains seven multi-part problems where students discover the steps to ratio problems.
Curated OER
Use or Make a Table
In this make a table worksheet, students read real world questions and write an equation to match the equation. Next, they solve the equation. This one-page worksheet contains two problems.
Education Development Center
Creating a Polynomial Function to Fit a Table
Discover relationships between linear and nonlinear functions. Initially, a set of data seems linear, but upon further exploration, pupils realize the data can model an infinite number of functions. Scholars use multiple representations...
Curated OER
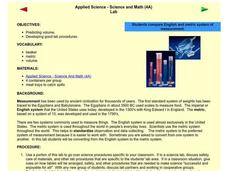
Applied Science - Science and Math Lab
Although it was written to use in a science class, this measurement lesson is adaptable to Common Core standards in math for measurement and data. Youngsters are introduced to two types of measurement systems. They use both the...
Radford University
Danger! – An Analysis of the Death Toll of Natural Disasters
Decipher the danger of natural disasters. Using researched data, scholars work in groups to create data displays on the number of deaths from different types of natural disasters. They share their graphical representations with the class...
Other popular searches
- Science Data Tables
- Reading Tables Science
- Making Tables Science
- Periodic Tables Science
- Input/output Tables Science


