Mathed Up!
Two Way Tables
When presented with categorical data, a two-way frequency table is a great way to summarize the information. Pupils organize categorical data using a two-way table, then use the tables to determine missing data and to calculate simple...
Curated OER
Chairs Around the Table
Youngsters become flexible problem solvers with this challenging instructional activity. If there are 24 square tables in a restaurant, how many customers can be seated at one time? They can use manipulatives or draw pictures to help...
EngageNY
Summarizing Bivariate Categorical Data in a Two-Way Table
Be sure to look both ways when making a two-way table. In the lesson, scholars learn to create two-way tables to display bivariate data. They calculate relative frequencies to answer questions of interest in the 14th part of the series.
Curated OER
Student Costs Data Table
Young scholars compare and contrast two routes selected for a virtual field trip. They create a data table of educational activities, lodging, and meal costs using Microsoft Excel software.
Curated OER
Getting Started with Interactive Math Notebooks
Set young mathematicians up for success with this interactive math notebook. Including a list of rules and expectations for using the notebooks, as well as templates for a creating a cover page and table of contents, this resource...
Statistics Education Web
It’s Elemental! Sampling from the Periodic Table
How random is random? Demonstrate the different random sampling methods using a hands-on activity. Pupils use various sampling techniques to choose a random sample of elements from the periodic table. They use the different samples to...
Pennsylvania Department of Education
What is the Chance?
Fourth and fifth graders make predictions using data. For this analyzing data lesson, pupils use experimental data, frequency tables, and line plots to look for patterns in the data in order to determine chance. You will need to make a...
University of Utah
Statistics-Investigate Patterns of Association in Bivariate Data
Young mathematicians construct and analyze patterns of association in bivariate data using scatter plots and linear models. The sixth chapter of a 10-part eighth grade workbook series then prompts class members to construct and interpret...
CK-12 Foundation
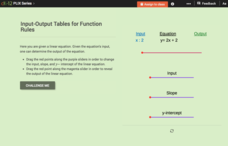
Input-Output Tables for Function Rules
Make the abstract a bit more concrete with an interactive that asks learners to slide an input value through a function to determine the output. Changing the slope and y-intercept allows them to see the how the output values change.
Curated OER
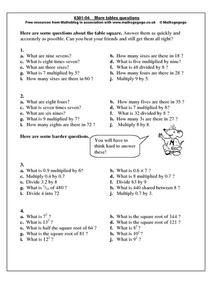
More Tables Questions
For this multiplication worksheet, students answer 40 short answer questions relating to a table square. Students answer each question as fast and as accurately as they can.
Curated OER
Word Search Y3, 4 x Table
In this math word search worksheet, students solve the 10 multiplication problems at the bottom of the page, which are all in the 4 times table. They then find the numbers, in word form, in the word search above. Students circle the...
Curated OER
Tables Grids
For this multiplication worksheet, students learn how to fill out a multiplication table or grid. They then fill one out on their own with 36 blank spaces. The answers are on the last page.
Curated OER
Investigation - Mathematical Reasoning: Tables and Chairs
Fourth graders draw pictures and diagrams as they attempt to solve a mathematical problem involving the arrangement of eleven tables shaped like equilateral triangles and the seating of exactly twenty-five people.
California Education Partners
T Shirts
Which deal is best? Learners determine which of two companies has the best deal for a particular number of shirts. They begin by creating a table and equations containing each company's pricing structure. Individuals finish the seventh...
Noyce Foundation
Ducklings
The class gets their mean and median all in a row with an assessment task that uses a population of ducklings to work with data displays and measures of central tendency. Pupils create a frequency chart and calculate the mean and median....
Rice University
Introductory Statistics
Statistically speaking, the content covers several grades. Featuring all of the statistics typically covered in a college-level Statistics course, the expansive content spans from sixth grade on up to high school. Material comes from a...
Achieve
False Positives
The test may say you have cancer, but sometimes the test is wrong. The provided task asks learners to analyze cancer statistics for a fictitious town. Given the rate of false positives, they interpret the meaning of this value in the...
Curated OER
Review Graphing Parabolas & Circles
Students review how to graph parabolas. They practice graphing two different parabolas using the vertex and table method. They solve problems related to graphing circles, determining the radius and the center.
Mathed Up!
Frequency Polygons
Frequency polygons are a different way to represent frequencies over intervals. Pupils take frequencies for intervals of data from a frequency table and plot them as a frequency polygon. Budding mathematicians find information about the...
Curated OER
Tables grids
In this multiplication worksheet, students learn how to fill out a multiplication tables grid. They then complete the one in the packet, which has 36 blanks to fill in. The answers are on the last page.
Curated OER
4 Times Table
For this multiplication worksheet, students read and learn about the 4 times table. They then solve 20 multiplication problems in which they multiply 4 by a single digit number. The answers are on the last page.
Curated OER
7 Times Table
In this 7 times table worksheet, students solve 20 multiplication math problems by dividing each number by 7. Students place their answers in the boxes provided.
Curated OER
6 Times Table
In this 6 times table worksheet, learners solve 20 multiplication math problems by multiplying each number by 6. Students place their answers in the boxes provided.
Curated OER
Word Search Y4 6 x table
In this math word search learning exercise, students find the 6 x table answer in the number square and circle them. They then complete the 10 sums at the bottom of the page. The answers are on the second page.
Other popular searches
- Using Table of Contents
- Table of Contents Index
- Table of Contents Sheets
- Table of Contents Worksheets
- Using a Table of Contents
- Table of Contents and Index
- Table of Contents Learning
- Table of Contents Lessons
- Using the Table of Contents
- Table of Contents, Headings


