EngageNY
Summarizing a Data Distribution by Describing Center, Variability, and Shape
Put those numbers to work by completing a statistical study! Pupils finish the last two steps in a statistical study by summarizing data with displays and numerical summaries. Individuals use the summaries to answer the statistical...
EngageNY
Summarizing a Distribution Using a Box Plot
Place the data in a box. Pupils experiment with placing dividers within a data set and discover a need for a systematic method to group the data. The 14th activity in a series of 22 outlines the procedure for making a box plot based...
Curated OER
Bread in a Bag
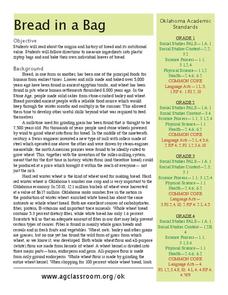
Could the history of bread really be interesting? Yes, it could! An informational text gives scholars wheat production background from 8,000 years ago, discussing different types of bread and the current industry in Oklahoma. Learners...
EngageNY
Summarizing Deviations from the Mean
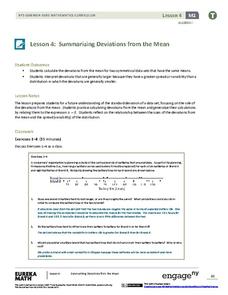
Through a series of problems, learners determine the variability of a data set by looking at the deviations from the mean. Estimating means of larger data sets presented in histograms and providing a way to calculate an...
EngageNY
Summarizing Bivariate Categorical Data
How do you summarize data that cannot be averaged? Using an exploratory method, learners complete a two-way frequency table on super powers. The subject matter builds upon 8th grade knowledge of two-way tables.
EngageNY
Summarizing Bivariate Categorical Data with Relative Frequencies
It is hard to determine whether there is a relationship with the categorical data, because the numbers are so different. Working with a familiar two-way table on super powers, the class determines relative frequencies for each...
Curated OER
Study Jams! Creating Equations from Word Problems
Word problems are full of information waiting to be deciphered. This animated video explains how to look for the important parts and how to translate those word cues into the correct signs. Go through a problem from start to finish and...
Curated OER
Organizing Data
Third graders investigate ways to organize data. In this tally marking lesson plan, 3rd graders practice drawing tally marks to represent an item of data. Students also make connections with skip counting by fives.
Teacher's Corner
Hey Batter, Wake Up!
Does jet lag affect a baseball team's performance in games? Read about how a baseball team's chance of winning a game can be affected by traveling over one, two, and three time zones. Readers then respond to five short answer questions...
Curated OER
Describing Data
Your learners will practice many ways of describing data using coordinate algebra in this unit written to address many Common Core State Standards. Simple examples of different ways to organize data are shared and then practice problems...
EngageNY
Understanding Box Plots
Scholars apply the concepts of box plots and dot plots to summarize and describe data distributions. They use the data displays to compare sets of data and determine numerical summaries.
EngageNY
Analyzing Data Collected on Two Variables
Assign an interactive poster activity to assess your class's knowledge and skill concerning data analysis. The teacher reference provides solid questions to ask individuals or groups as they complete their posters.
Curated OER
My Credit Card Plan
Remember all those credit card tables lined up on your college campus? So alluring and dangerous, if you don't know what you're doing. Prepare your pre-college attendees for life by offering a lesson on credit management. They discuss...
Statistics Education Web
First Day Statistics Activity—Grouping Qualitative Data
Making groups of groups can help to organize data. Classes use statistics to group themselves using descriptive adjectives. The objective is for learners to understand that grouping qualitative data is useful when the original groups are...
EngageNY
Modeling Relationships with a Line
What linear equation will fit this data, and how close is it? Through discussion and partner work, young mathematicians learn the procedure to determine a regression line in order to make predictions from the data.
EngageNY
Properties of Dilations
Investigate dilations to learn more about them. The second segment in a series of 16 provides a discussion of properties of dilations by going through examples. The problem set provides opportunities for scholars to construct dilations.
EngageNY
Selecting a Sample
So what exactly is a random sample? The 15th part in a series of 25 introduces the class to the idea of selecting samples. The teacher leads a discussion about the idea of convenient samples and random samples. Pupils use a random...
EngageNY
Describing the Center of a Distribution Using the Median
Find the point that splits the data. The instructional activity presents to scholars the definition of the median through a teacher-led discussion. The pupils use data lists and dot plots to determine the median in sets with even and odd...
Curated OER
Common Procedure Costs
Kids never think about the cost of medical expenses, because they never think they'll get hurt. To better understand personal financial planning, learners research common medical procedures and their costs. They use a worksheet and the...
Curated OER
Adding & Subtracting (Combining) Integers
Maintain a positive atmosphere in your math class with this fun lesson on adding and subtracting integers. After first explaining the rules for combining positive and negative numbers, this resource uses a comic strip...
Curated OER
How To Measure Area
Geometers learn how to measure the area in square units. They use the floor in the classroom as a visual to measure a square foot area. They use classmates to fill the space and expand the measured area square foot by square foot until...
Curated OER
Death by Particles
Emerging epidemiologists define relative risk and read an article about the effect of particulate pollution on the cardiovascular health of women. They record the relative risk values, graph them, and answer analysis questions. This is a...
Curated OER
Way to Go Bananas
Fifth graders explore bananas. In this interdisciplinary lesson plan, 5th graders discover the dietary benefits of bananas, complete a fruits word search, write banana myths, research banana recipes, and use their problem solving skills...
EngageNY
Summarizing Bivariate Categorical Data in a Two-Way Table
Be sure to look both ways when making a two-way table. In the lesson, scholars learn to create two-way tables to display bivariate data. They calculate relative frequencies to answer questions of interest in the 14th part of the series.


