Curated OER
Reading Comprehension 1: Level 11
Here’s a reading comprehension assessment that will capture the interest of your learners. Stink bugs and the danger they pose to farmers is the subject of the passage, while the eight questions ask readers to infer, predict, summarize...
EngageNY
Summarizing a Data Distribution by Describing Center, Variability, and Shape
Put those numbers to work by completing a statistical study! Pupils finish the last two steps in a statistical study by summarizing data with displays and numerical summaries. Individuals use the summaries to answer the statistical...
Teacher's Corner
Hey Batter, Wake Up!
Does jet lag affect a baseball team's performance in games? Read about how a baseball team's chance of winning a game can be affected by traveling over one, two, and three time zones. Readers then respond to five short answer questions...
Curated OER
Bread in a Bag
Could the history of bread really be interesting? Yes, it could! An informational text gives scholars wheat production background from 8,000 years ago, discussing different types of bread and the current industry in Oklahoma. Learners...
Curated OER
Shorten the Length
Learn how to summarize by identifying main ideas and supporting details. Readers cross out unimportant information as they read through a text. Is it a random detail? Cross it out! They then draw a concept map, placing the main idea in...
EngageNY
Overcoming a Second Obstacle in Factoring—What If There Is a Remainder?
Looking for an alternative approach to long division? Show your classes how to use factoring in place of long division. Increase their fluency with factoring at the same time!
EngageNY
Summarizing a Distribution Using a Box Plot
Place the data in a box. Pupils experiment with placing dividers within a data set and discover a need for a systematic method to group the data. The 14th activity in a series of 22 outlines the procedure for making a box plot based...
EngageNY
Summarizing Bivariate Categorical Data in a Two-Way Table
Be sure to look both ways when making a two-way table. In the lesson, scholars learn to create two-way tables to display bivariate data. They calculate relative frequencies to answer questions of interest in the 14th part of the series.
New York State Education Department
TASC Transition Curriculum: Workshop 4
Why is it important to use precise language? Participants explore this question in the fourth activity in a series of 15 on effective instruction. Perfect for all content areas, the activity promotes appropriate language choice through...
EngageNY
More Practice with Box Plots
Don't just think outside of the box — read outside of it! The 15th lesson in a 22-part unit provides pupils more work with box plots. Learners read the box plots to estimate the five-number summary and interpret it within the context....
Rice University
Calculus Volume 2
Delve into the middle of calculus. The resource is the second eBook of three that covers the complete calculus content. Seven chapters begin with integrals and different methods of integration before moving on to differential equations....
American Statistical Association
Colors Challenge!
Does writing the name of a color in a different colored ink affect one's ability to read it? Scholars design an experiment to answer this question. They collect the data, analyze the statistics, and draw a conclusion based on...
Mathed Up!
Two Way Tables
When presented with categorical data, a two-way frequency table is a great way to summarize the information. Pupils organize categorical data using a two-way table, then use the tables to determine missing data and to calculate simple...
Curated OER
Practice with Experiment Conclusions
In this conclusions worksheet, learners write one sentence to summarize the data given to them in a graph. Students complete 3 problems.
Curated OER
Geo Jammin' By DeSign - Day 7, Lesson 37: Summarizing for the Summative
Students listen for specific information during summary presentations. They practice giving feedback on given topic according to a set of standards. The speaker reports to the rest of class from a report and listeners determine if...
Curated OER
Death by Particles
Emerging epidemiologists define relative risk and read an article about the effect of particulate pollution on the cardiovascular health of women. They record the relative risk values, graph them, and answer analysis questions. This is a...
Curated OER
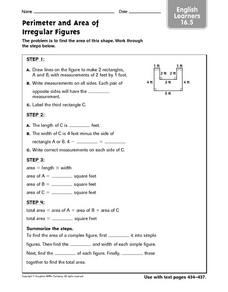
Perimeter and Area of Irregular Figures ELL 16.5
For this finding area worksheet, students solve the area of an irregular figure by reading and performing step by step operations. Students complete fourteen steps to solve and summarize finding the area.
Curated OER
How Many People Live in Your Household?
Students create a pictograph showing household size for the class.In this data collection and graphing lesson, the teacher guides students through the creation of a concrete object graph, then students analyze and summarize the results.
Curated OER
Why Would I Owe My Soul to the Company Store?
Sixth graders listen to "Sixteen Tons" by Tennessee Ernie Ford and discuss what it means to owe one's soul to a store. In this mathematics instructional activity, 6th graders determine what a miner's income was minus his expenses...
Curated OER
It's Greek to Me!
Students explore Greek Mythology. In this Greek Mythology unit, students read myths, pantomime vocabulary words, practice research skills, create city-states, and demonstrate knowledge of ratios and proportions. This unit includes many...
Curated OER
Equadorian Rainforest: The Tropical Supermarket
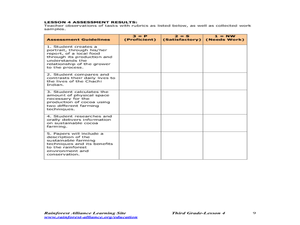
Students study the concept of sustainable agricultural practices through cocoa farming and the lives of the people who are the producers. Students watch a slide show and read a story which helps them understand the origins of chocolate,...
Curated OER
Getting the Point!
Students explore the American cattle industry history. In this United States history and reading comprehension cross curriculum lesson, students read an article about the history of longhorn cattle, then answer comprehension questions on...
Ohio Department of Education
I Can Name that Angle in One Measure! - Grade Eight
Collaborative groups work with geometry manipulatives to investigate conjectures about angles. They create a graphic organizer to use in summarizing relationships among angles in intersecting, perpendicular and parallel lines cut by a...
Curated OER
Activity Plan 3-4: Scrumptious Shapes
Students discover together that shapes are everywhere - even in the food we eat. In this early childhood math and art lesson, students read about shapes, identify foods that match geometric shapes, and create a class book.


