Pinecrest Preparatory Middle and High School
Short Story Planning Guide
A short story is only as strong as its characters, development, and conflicts. Encourage the young authors in your class to plan their stories based on the elements of narrative writing, all provided in brainstorming graphic organizers.
Curated OER
Data Management and Probability: Applications
In this data management and probability applications worksheet, 7th graders solve 13 different types of problems that include finding the mean, median, mode, and range of each set of values, as well as, solving a number of word problems....
California Education Partners
Lashelles Garden
Let knowledge grow bountifully like plants in a garden. Given a diagram of a rectangular garden split into plots, scholars determine the area of the entire garden and the areas of the individual plots. As a culminating activity, they...
Curated OER
The Outsiders Study Guide
Provide this packet for your pupils as they pour over The Outsiders by S.E. Hinton. The study guide includes graphic organziers and comprehension as well as higher-level questions. Class members briefly summarize each chapter, compare...
Newspaper Association of America
Celebrating Women’s History Month
Examine the lives of four women—Blanche Stuart Scott, Madeleine L'Engle, Margaret Evans Price, and Sybil Ludington—in a 23-page activity packet. Each profile comes with a set of vocabulary and reading comprehension questions. Further...
Bowland
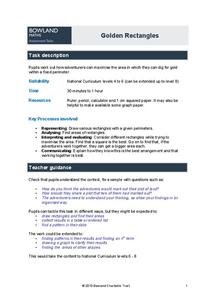
Golden Rectangles
Scholars must determine the maximum area for a rectangular plot of land enclosed with 100 meters of rope. As the work they discover patterns and numerical approaches to solve the problem.
EngageNY
The Mean as a Balance Point
It's a balancing act! Pupils balance pennies on a ruler to create a physical representation of a dot plot. The scholars then find the distances of the data points from the balance point, the mean.
Curated OER
Statistics
Seventh and eighth graders solve and complete three various types of problems. First, they find the median rate using the box-and-whisker plot shown. Then, learners describe the inter-quartile range. In addition, they determine whether...
EngageNY
From Ratio Tables, Equations and Double Number Line Diagrams to Plots on the Coordinate Plane
Represent ratios using a variety of methods. Classmates combine the representations of ratios previously learned with the coordinate plane. Using ratio tables, equations, double number lines, and ordered pairs to represent...
Curated OER
Where the Red Fern Grows Chapter 10-11 Worksheet
Focus on characterization in Wilson Rawls' well-known novel. First, learners answer a series of questions about the chosen chapters, paying attention to plot, use of language, and character interactions. Then, using the provided Venn...
Education City
Reading Comprehension
New ReviewCelebrate National Reading Month in March—or any month of the year—with a selection of versatile graphic organizers. The worksheets prompt readers to compare characters easily, predict what will happen next in a story, track their...
Curated OER
Statistical Inquiry
In this statistical inquiry worksheet, students analyze and interpret a variety of diagrams such as a scatter plot, bar graph and pie charts. They create tables and other diagrams to support given data. This two-page worksheet contains 3...
Curated OER
Integrated Algebra
In this integrated algebra worksheet, students solve problems covering topics studied during the year. Problems include topics such as slope-intercept, Venn Diagrams, finding the solution to multi-step algebra problems, writing...
Curated OER
Data Handling
In this data handling learning exercise, students explore multiple ways to represent data. They create stem and leaf plots, histograms, and bar charts. Students examine and interpret diagrams and statistics. This eleven-page learning...
Curated OER
Statistical Calculations Using M&Ms
In this frequency worksheet, students investigate, frequency, box plots, and percentage using a package of M&Ms. Copies of the actual correspondences with the Mars company are also included.
DeKalb County Schools
Compare/Contrast
A series of reading activities is sure to engage your young readers! Based on comparing and contrasting ideas, the packet provides opportunities to compare characters, themes, texts, and other elements of fiction.
Curated OER
How is a Star's Color Related to Its Temperature?
In this star color and temperature worksheet, students create a Hertzsprung-Russell diagram in order to determine how star brightness, color, temperature, and class are related. Once diagram is complete, they answer 6 short answer...
Curated OER
AC Phase
In this AC phase worksheet, students answer 24 questions about AC and DC voltages, phasor diagrams, sine wave graphs and Lissajous figures.
Curated OER
Statistical Diagrams
In this statistics activity, students explore five activities that require analysis and interpretation of maps, charts, and scatter plots. The six page lesson includes five activities or experiments with short answer questions. Answers...
Curated OER
LRO and the Apollo-11 Landing Site
In this Apollo-11 landing site worksheet, students read about the NASA Lunar Reconnaissance Orbiter (LRO) that will collect images at a higher resolution than ever before. Students study a grid showing the lunar landing site from Apollo...
Curated OER
"The Most Dangerous Game" Study Guide
After reading Richard Connell's best known work, "The Most Dangerous Game," have your class complete the 12 study questions included here. Readers answer plot related questions, compare and contrast characters, and analyze story elements.
California Education Partners
Animals of Rhomaar
Investigate the growth rates of alien animals. Pupils study fictional animals from another planet to determine how much they grow per year. The investigators plot the growth of their animals over a period of time and then compare them to...
Curated OER
Histograms and Statistical Graphics
In this statistics worksheet, students solve 6 data problems. They construct a histogram of given data, they create a frequency polygon, and a stem and leaf diagram. Students create a dot plot and a pie chart for given data sets. On the...
Curated OER
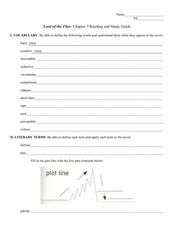
Reading and Study Guide: Lord of the Flies Chapter Three
In this reading and study guide for Lord of the Flies, students must define vocabulary words found in the reading, complete a plot diagram and answer reading comprehension questions.


