Curated OER
Opening the Case
Students participate in a class survey and then design an experiment and use graphs and statistics to assist them in solving a problem. They organize the results of the survey in a stem-and-leaf plot and find the range, median, mean, and...
Curated OER
How's The Weather?
Students make a box and whiskers plot using the TI-73 graphing calculator. Each student would have their own calculator but they would work in small groups of two or three to help each other enter the data and make the plots.
Curated OER
Student Heights
Students measure the heights of their fellow classmates and create a box and whisker plot to display the data. In this measurement lesson plan, students analyze the data and record results.
Curated OER
Box and Whiskers
Middle schoolers discover how to relate collected data with a box and whiskers graph in a number of formats. They collect, organize, create, and interpret a box and whiskers graph. Pupils interpret the difference between sets of data,...
Curated OER
Box-and-Whisker
Seventh graders are introduced to the concept of box-and-whisker plots. A step-by-step process for creating a box-and-whisker plot is provided. The goal of the lesson is that students study the components of a box-and-whisker plot and be...
Curated OER
Hurricane Tracking
Students access the Internet to find information on current hurricanes. They get locations, speeds, and air pressures and then plot the location of the hurricane on a hurricane-tracking map. They also access the FEMA website to solve...
Virginia Department of Education
Middle School Mathematics Vocabulary Word Wall Cards
Having a good working knowledge of math vocabulary is so important for learners as they progress through different levels of mathematical learning. Here is 125 pages worth of wonderfully constructed vocabulary and concept review cards....
Curated OER
In the Wake of Columbus
Young scholars explore how the population decreased in native cultures.
Virginia Department of Education
May I Have Fries with That?
Not all pie graphs are about pies. The class conducts a survey on favorite fast food categories in a lesson plan on data representation. Pupils use the results to create a circle graph.
Curated OER
Drops on a Penny
Young scientists explore the concept of surface tension at is applies to water. In this activity, learners use a dropper to place drops of water on a penny. Each group guesses how many drops a heads-up penny will hold, then conducts the...
Curated OER
MAP Practice
In this geometry worksheet, students create circle, line and bar graphs using different comparisons of events. There are 24 questions with an answer key.
Virginia Department of Education
Mathematics Vocabulary Cards - Grade 5
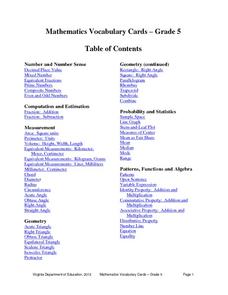
Elevate your fifth graders' understanding of math concepts with a series of vocabulary posters. Featuring terms concerning probability and statistics, measurement, algebra, and decimal place value (and many more), the posters are sure to...
Willow Tree
Circle Graphs
Pie isn't just for eating! Scholars learn to create pie charts and circle graphs to represent data. Given raw data, learners determine the percent of the whole for each category and then figure out the degree of the circle that percent...
Curated OER
Raisin the Statistical Roof
Use a box of raisins to help introduce the concept of data analysis. Learners collect, analyze and display their data using a variety of methods. The included worksheet takes them through a step-by-step analysis process and graphing.
Curated OER
Data Analysis of Ground Level Ozone
Sixth graders construct and interpret graphs from ozone data collected in Phoenix area. Can be adapted to other areas.
Curated OER
Ornithology and Real World Science
Double click that mouse because you just found an amazing lesson! This cross-curricular Ornithology lesson incorporates literature, writing, reading informational text, data collection, scientific inquiry, Internet research, art, and...
Curated OER
Transformation, Reflections, Rotations and Translations
Young scholars create a quilt, using different patterns. In this geometry lesson, students apply prior knowledge as they use different patterns to help them create a quilt using transformations and geometric shapes.
Curated OER
Which Amusement Park Would You Choose?
Young scholars analyze data related to amusement parks and create a spreadsheet to display the data. They read the data and predict which amusement park they think is safer, create a spreadsheet and graph, and write a proposal based on...
Curated OER
The Mean, the Median, and the Mode
In this statistics and probability worksheet, students analyze data to determine the mean, median, or mode as indicated for the given set of data. The four page worksheet contains a combination of twenty-five multiple choice and free...
Curated OER
Quartiles, Percentiles, and Cumulative Frequency
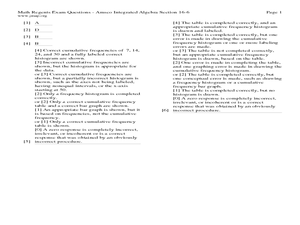
In this statistics lesson, 11th graders are asked to calculate the percentiles, quartiles and cumulative frequency given different graphs and data. There are 6 questions with an answer key.
Curated OER
Graph it!
Sixth graders view a Stacked Graph, and discuss what it shows. Students discuss the basics of graphing: labels, intervals, legends x and y axis... Students create individual stacked graphs from provided information. Students view a...
Curated OER
Infusing Equity Gender into the Classroom
Students investigate if gender makes a difference in the classroom. For this statistics lesson, students collect data on whether equity by gender in the classroom makes students more successful.
Curated OER
Graphing Lesson Plans
By using hands-on graphing lesson plans students can learn how to collect data, and display the information using graphs.
Curated OER
Math Regents Exam Questions - Pearson Integrated Algebra P.304: Histograms
In this histograms instructional activity, students solve 9 short answer, multiple choice, and graphing problems. Students construct frequency tables and histograms of data.


