Curated OER
Button Bonanza
Collections of data represented in stem and leaf plots are organized by young statisticians as they embark some math engaging activities.
Fort Bend Independent School District
Data Analysis - AP Statistics
What better way to study survey design than to design your own survey! Bring a versatile data analysis project to your AP Statistics class, and encourage them to apply the practices from their instructions to a real-world survey...
Varsity Tutors
Varsity Tutors: Hotmath: Algebra Review: Stem and Leaf Plots
Find a quick, concise explanation of stem-and-leaf plots. an example is given and clearly explained.
Varsity Tutors
Varsity Tutors: Hotmath: Practice Problems: Stem and Leaf Plots
Eight problems present various aspects of using stem-and-leaf plots. They are given with each step to the solution cleverly revealed one at a time. You can work each step of the problem then click the "View Solution" button to check each...
Shodor Education Foundation
Shodor Interactivate: Stem and Leaf Plot
Shodor offers this interactive Stem and Leaf Plotter. The mean, median, and mode may be calculated or checked for accurracy with your given data. Be sure to check the "What?" link to find exercises and a lesson plan.
Other
Northern Michigan University: Stem and Leaf Plot
Site discusses how to use stem-and-leaf plots with an example and the steps listed for easy reading.
Texas Instruments
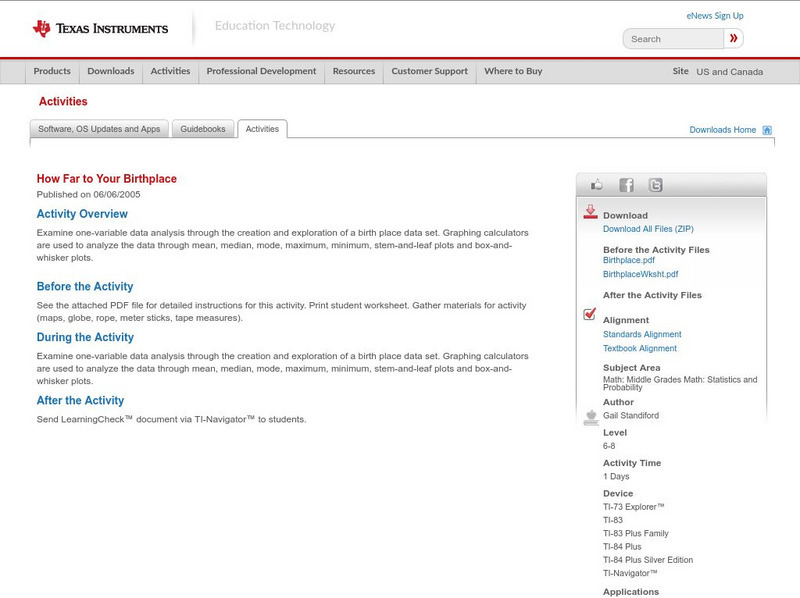
Texas Instruments: How Far to Your Birthplace
Examine one-variable data analysis through the creation and exploration of a birth place data set. Graphing calculators are used to analyze the data through mean, median, mode, maximum, minimum, stem-and-leaf plots and box-and-whisker...
Oswego City School District
Regents Exam Prep Center: Practice With Organizing and Interpreting Data
Several problems are presented to test your skills in creating and interpreting frequency tables, pie charts, box-and-whisker and stem-and-leaf plots.
National Council of Teachers of Mathematics
Nctm: Illuminations: Advanced Data Grapher
The Advanced Data Grapher can be used to analyze data with box plots, bubble graphs, scatterplots, histograms, and stem-and-leaf plots.
Other popular searches
- Math Stem and Leaf Plots
- Creating Stem and Leaf Plot
- Stem and Leaf Plot Images
- Stem and Leaf Plot Worksheets
- Math Stem and Leaf Plot
- Leaf Stem Plots
- Stem and Leaf Plot of Weather


