EngageNY
Summarizing Bivariate Categorical Data
How do you summarize data that cannot be averaged? Using an exploratory method, learners complete a two-way frequency table on super powers. The subject matter builds upon 8th grade knowledge of two-way tables.
Georgia Department of Education
Math Class
Young analysts use real (provided) data from a class's test scores to practice using statistical tools. Not only do learners calculate measures of center and spread (including mean, median, deviation, and IQ range), but also use this...
College Board
Sampling Distributions
The validity of data depends on the strength of the sample. A collection of instruction and activities focuses on sampling distributions and the analysis of that data. Scholars learn about distribution tests such and Central Limit...
Illustrative Mathematics
Why Randomize?
Your statisticians draw several samplings from the same data set, some randomized and some not, and consider the distribution of the sample means of the two different types of samplings. The exercise demonstrates that non-random samples...
Curated OER
Surveys and Sampling Methods
Math whizzes select the statement that best describes the type of sampling being described. Each of the five problems describes a situation and students are presented with options options. An interactive hint button is provided for each...
Computer Science Unplugged
Sharing Secrets—Information Hiding Protocols
Did you know that you can find the average age of a group of people without anyone having to real their age? This resource provides directions for way to do just that. After the activity, class members read a short passage that provides...
Curated OER
An Introduction to Mathematica and the "Birthday Problem"
Twelfth graders determine the probability of two people in their class sharing the same birthday. In this determining the probability of two people in their class sharing the same birthday problem lesson, 12th graders use Mathematica to...
Curated OER
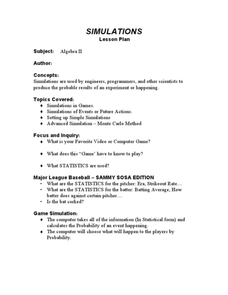
Simulation and Statistics
Students perform simulation of video games as they explore statistics. In this algebra lesson, students relate concepts of statistics and data collection to solve problems. They decide their next step based on the previous assessment of...
Curated OER
Data Collection
Learners investigate qualitative and quantitative data. In this statistics activity, students gather data on heights and weights of people and graph the distribution. Learners discuss the differences between qualitative and quantitative...
Curated OER
How Many?
Middle schoolers explore and design ways to collect data through simulations and random samples. They perform two experiments to determine the answers to various probability problems, and present the data/graphs in the form of a...
Curated OER
Galaxy Hunter - A Cosmic Photo Safari
Space science stars journey through our night sky and take virtual photos of galaxies to investigate simple random samples. Higher math is used to analyze the data collected. Copy the evaluation/assessment questions onto a handout for...
Curated OER
Data Analysis Using Technology
Analyze data using technology. Middle schoolers design data investigations, describe data, and draw their own conclusions. Then they select the best type of graph, graph and interpret the data, and look for patterns in trends. They also...
Curated OER
8.SP.1Texting and Grades I
Here is a fitting question for middle schoolers to consider: Is there a relationship between grade point average and frequency of sending texts? Starting statisticians examine a scatter plot and discuss any patterns seen.
Curated OER
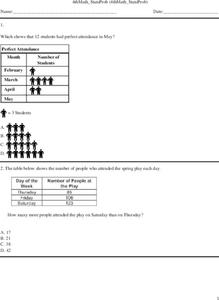
Fourth Grade Math Practice-Statistics
In this 4th grade statistics worksheet, students complete a total of 7 problems. An answer key is provided; problems are related to statistics.
Curated OER
Data Analysis Worksheet
In this probability learning exercise, 11th graders solve problems using simple random sample, cluster sample, bias, population and systematic sample. They match the questions to its definition.
Curated OER
Probability
In this probability worksheet, students solve and complete 16 various types of problems related to statistics. First, they determine the probability of the statistics that are true as shown. Then, students find the conditional...
Curated OER
Chapter 5 Review
In this statistics instructional activity, students solve and complete 10 different types of problems. First, they determine the probability of various actions described. Then, students describe an appropriate model for the number...
Curated OER
Combinations and Permutations
In this statistics worksheet, students solve the probability of an event occurring using probability, permutation and combination. There are 17 questions with an answer key.
Curated OER
Leveled Problem Solving: Experimental Probability
In this using probability to solve word problems worksheet, students use statistics, averages, and even numbers, to problem solve. Students solve six problems.
Curated OER
Penny's Pizza
Students develop a list of possible outcomes as a method of finding probability related to a pizza statistics problems. They read the problems together as a class, brainstorm ways to solve the problem, and in partners solve the pizza...
American Statistical Association
Chunk it!
Chunking information helps you remember that information longer. A hands-on activity tests this theory by having learners collect and analyze their own data. Following their conclusions, they conduct randomization simulations to test...
American Statistical Association
More Confidence in Salaries in Petroleum Engineering
Making inferences isn't an exact science. Using data about salaries, learners investigate the accuracy of their inferences. Their analyses includes simulations and randomization tests as well as population means.
Curated OER
Math for Fourth Grade: Statistical Charts
In this math for fourth grade statistical charts activity, 4th graders answer 7 multiple choice questions in standardized test format about data, charts and graphs.
Statistics Education Web
Using Dice to Introduce Sampling Distributions
Investigate the meaning of a sample proportion using this hands-on activity. Scholars collect data and realize that the larger the sample size the more closely the data resembles a normal distribution. They compare the sample proportion...


