Mathematics Assessment Project
Mean, Median, Mode, and Range
What a find! Here is a lesson plan, designed to meet sixth grade math Common Core standards, that focuses on the calculation of different measures of center for the scores from a penalty shoot-out competition. An independent...
Curated OER
Mean, Median, Mode, and Range - Homework 14.3
For this data and statistics worksheet, students find the mean, median, mode, and range of 4 different sets of data. Next, students solve 1 word problem where they find the mean.
Curated OER
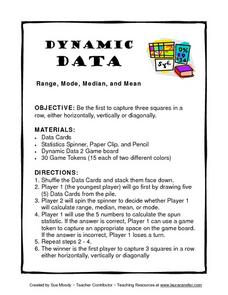
Dynamic Data Range, Mode, Median, and Mean
For this lesson, Dynamic Data Range, Mode, Median, and Mean, young scholars play a game while figuring range, mode, median, and mean. Students spin for their task, figure the mode, mean, median or range of a row of numbers and gain a...
Curated OER
Statistics - Central Tendency
In this statistics activity, learners solve and complete 13 different problems that include creating various box-and-whisker plots. First, they write a definition for mean, median, mode and range. Then students explain how to determine...
Education Development Center
Creating Data Sets from Statistical Measures
Explore the measures of central tendency through a challenging task. Given values for the mean, median, mode, and range, collaborative groups create a set of data that would produce those values. They then critique other answers and...
Shodor Education Foundation
Measures
Take a look at data from a statistical lens. An interactive allows pupils to enter data set, labeling the data including the units used. Manipulating the applet, learners select the statistics to calculate that include total, mean,...
National Security Agency
Are You Ready to Call the Guinness Book of Records?
Learners design questions that can be answered by collecting data. In this line-plot lesson, pupils collect data and graph on a line plot on world records. An abundant supply of teacher support is provided in this resource.
Curated OER
Using Mean, Median, Mode, and Range through Basketball
Eighth graders use the sports pages of the newspaper to analyze the mean, median, mode and range of basketball statistics.
Curated OER
Statistics
In this statistics worksheet, 7th graders solve and complete 5 different problems related to determining various statistics. First, they find the average of a given set of numbers. Then, students find the median and mode of each set of...
Curated OER
Mean, Median, Mode and Range
Fourth graders investigate when to find the mean, median, mode and range. In this statistical concepts instructional activity, 4th graders collect data, make observations and graph the data. Students verify their work on the computer.
Curated OER
Energy Audit
Students collect data about energy usage and use mathematical calculations to analyze their data. In this energy conservation and statistics math activity, students survey their homes to complete an energy usage worksheet. Students...
Curated OER
What's Your Average? What Do You Mean? I'm More Than Just Average
Upper grade and middle schoolers collect data, analyze and interpret the data. This three-part lesson should provide learners with a firm understanding about the differences between mean, median, and mode and how to perform the...
Curated OER
How Alike Are We?
Fourth graders find the range, mode, median, and mean for each of the data sets (height and shoe size). They discuss which measure of central tendency for each data set best represents the class and why. Students graph the shoe size and...
Curated OER
Data Scavenger Hunt
Eighth graders discuss how data is collected and participate in data collection through a survey. They complete a scavenger hunt on the Internet to gain understanding of the data measures mean, median, mode, and range.
Curated OER
Create Your Own Form
Students gather and organize data using a mock census form, and determine mean, mode, range, and median for sets of data.
Curated OER
What Does Average Look Like?
Fifth graders explore the concepts of range, median, mode, and mean through the use of graphs drawn from models. They use manipulatives to represent data they have collected within their groups, and compare the differences between mode,...
Curated OER
Introduction to Statistics: Mean, Median, and Mode
Students explore the concepts of mean, median, and mode. They develop an understanding and familiarity with these concepts. Students explore mean and median in an efficient way. Students explore three different measures of center.
Curated OER
Flicking Football Fun
Young mathematicians fold and flick their way to a deeper understanding of statistics with a fun, hands-on math unit. Over the course of four lessons, students use paper footballs to generate data as they learn how to create line...
Flipped Math
Unit 4 Review: One Variable Statistics
It's always nice to slow down and review. Scholars work on problems covering concepts on one-variable statistics. They create and interpret box plots and stem-and-leaf plots, determine the mean, median, mode, interquartile range, and...
Utah Education Network (UEN)
Statistics
Find the value in analyzing data values. Statistics is the focus in the fifth of seven installments of the 6th Grade Math series. Individuals learn to examine dot plots, histograms, and box plots by considering the shape, mean, median,...
Rice University
Introductory Statistics
Statistically speaking, the content covers several grades. Featuring all of the statistics typically covered in a college-level Statistics course, the expansive content spans from sixth grade on up to high school. Material comes from a...
Curated OER
Global Statistics
Students select appropriate data to determine the mean, median, mode and range of a set of data. They calculate the statistical data on literacy rates and life expectancy within each geographic region of the world. Students determine...
Curated OER
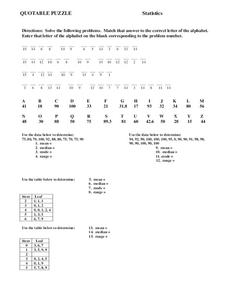
Statistics
In this statistics worksheet, 8th graders solve and complete 15 different problems. First, they solve each problem by using the data given to determine the mean, median, mode, and range for each set. Then, students match that answer to...
Math Mammoth
Stem-and-Leaf Plots 3
In this stem-and-leaf instructional activity, students place statistical data in a stem-and-leaf plot. They identify the median, and range in a given set of data. There are four multi-step problems on this one-page instructional activity.


