Curated OER
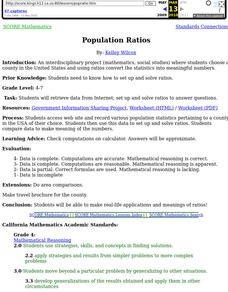
Population Ratios
Students access web site and record various population statistics pertaining to a county in the USA of their choice. They use this data to set up and solve ratios. They compare data to make meaning of the numbers.
Curated OER
Sampling Distribution of Sample Means
Learners collect data and crate a distribution sample. In this statistics lesson, students compare and contrast their collected data. This assignment requires the learners to be comfortable with navigating the internet.
Curated OER
Line Best Fit
Students identify the line of best fit. In this statistics lesson, students analyze graphs and plots to identify positive, negative or no correlation. They find the line of best fit for different scatter plots.
Curated OER
Play Ball!
Young scholars pretend as if they have been hired by the commissioner of Major League Baseball. Their task is to explain the mathematics of baseball so that more people enjoy the game.
Curated OER
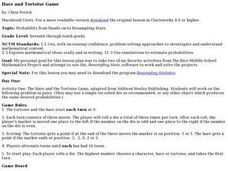
Hare and Tortoise Game
Students participate in the Hare and Tortoise Game and the "Castle Warwick" problem (from an Addison Wesley text). They use the computer to practice resampling statistics and explore different approaches to their tasks. They present th
Curated OER
Will There be Enough Water?
Students investigate water usage, water available, and water demand historically in the local area. They use projections of water usage, availability and demand up to the year 2050. Students use graphs to relate as well as compare and...
Curated OER
Scientific Graphs
Students organize data collected from their experiments using graphs. In this statistics and biology lesson, students organize their scientific data from an article into readable graphs. They define the usefulness of their graph and...
Curated OER
Skateboard Flex
Learners examine statistics by completing a skateboard measuring activity. In this flex lesson plan, students define what skateboard "flex" refers to and identify the proper method of measuring flex by conducting an experiment with...
Curated OER
Global Warming Statistics
Students research and collect data regarding temperature changes for a specific location and find the mean, median, and mode for their data. In this climate change lesson, students choose a location to research and collect data regarding...
Curated OER
Probability Of One Event
Students investigate the concept of probability. They use example problems in order to measure the likelihood of various outcomes. The lesson includes dialogue to be used by the teacher during direct instruction. They also use class...
Curated OER
Probability Two Events
Young scholars investigating the concept of probability practice the concept using a variety of different example problems. The lesson is delivered in a question and answer format. The frequency of answers is recorded in a data table for...
Curated OER
Statistical Sampling
Students collect data in the field and analyze it in class using tables and graphs to determine how many observations of a phenomenon are necessary to draw valid conclusions.
Curated OER
Tech Algebra: A Statistics Study
Students use the internet to gather a minimum of thirty pieces of data. Students create box and whisker graphs, and stem and leaf plots from the information. They calculate mean, median, mode, and range. Students write a summary and...
Statistics Education Web
Text Messaging is Time Consuming! What Gives?
The more you text, the less you study. Have classes test this hypothesis or another question related to text messages. Using real data, learners use technology to create a scatter plot and calculate a regression line. They create a dot...
American Statistical Association
How Random Is the iPod’s Shuffle?
Shuffle the resource into your lesson repertoire. Scholars use randomly-generated iPod Shuffle playlists to develop ideas about randomness. They use a new set of playlists to confirm their ideas, and then decide whether the iPod randomly...
Curated OER
Mathematics: A Picture's Worth a Thousand Words
Students examine school yearbooks from 1950 to the present. They count the number of male and female teachers and administrators. They compile date and extrapolate changes in job trends.
Education World
The African American Population in US History
How has the African American population changed over the years? Learners use charts, statistical data, and maps to see how populations in African American communities have changed since the 1860s. Activity modifications are included to...
Curated OER
Popcorn Nutrition
Students read a snack nutrition chart and answer questions. They compare nutrition levels of snack foods. They correctly calculate differences in nutritional value.
Curated OER
Cruising the Internet
Students identify the parts of an engine using a graph. In this statistics lesson, students make a graph from their collected data. They calculate the volume of a cylinder using a line of regression and a scatter plot.
Curated OER
Mean and Median
Students identify the different central tendencies. In this probability lesson, students create the correct type of graphs to analyze their data. They make predictions and draw conclusions from their data.
Curated OER
My Peanut Butter is Better Than Yours!
Students explore the concept of statistical data. In this statistical data instructional activity, students read an article about the dangers of peanut butter to those who are allergic. Students perform a taste test of two different...
Curated OER
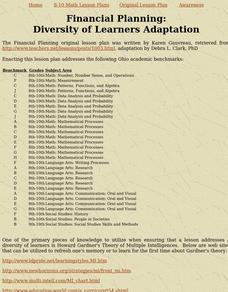
Financial Planning
Students participate in activities in order to apply the skills of sound financial planning that includes creating and maintaining a budget. The lesson is intended for diverse learners because of the application of The Multiple...
Curated OER
Oodles of Poodles
Students solve equations by graphing. In this algebra lesson, students differentiate between functions and relations. They use the TI to graph their equation and analyze the graph.
Curated OER
It's A Snap! (Place Value Made Easy)
Students are introduced to the importance of using place value in number systems. They view a video, play games, explore websites and research the pay scale of three jobs that interest them.


