Bowland
Crash Test
Use mathematics and simulations to investigate car crashes. IScholars test hypotheses involving car crashes. They collect, analyze, and display data from computer simulations to support or refute their hypotheses.
Curated OER
Statistics Newscast in Math Class
Learners study sports teams, gather data about the teams, and create a newscast about their data. In this sports analysis lesson, students research two teams and define their statistical data. Learners compare the two teams, make...
Curated OER
Bias in Statistics
Students work to develop surveys and collect data. They display the data using circle graphs, histograms, box and whisker plots, and scatter plots. Students use multimedia tools to develop a visual presentation to display their data.
Curated OER
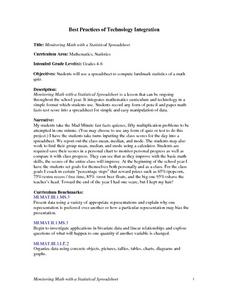
Monitoring Math with a Statistical Spreadsheet
Students use a spreadsheet to compute landmark statistics of a math
quiz. This lesson can be ongoing throughout the school year and it integrates mathematics curriculum and technology in a simple format for student use.
Curated OER
Math League Baseball: Five Week Project
Eighth graders analyze how to use statistics, change fractions to decimal, and graph their statistics. They draft players from Major League Baseball eams and chose on player for each position, including 3 oufielders and one designated...
Curated OER
How Has Math Evolved?
Eighth graders pick a topic or person to research related to the history of mathematics. They brainstorm and create a concept map, using the multimedia software inspiration, about what they are researching and want to examine. They then...
Curated OER
Graphing Statistics & Opinions About Pets
Students explore how to use a double bar graph by polling other students about their feelings and experiences with pets. They also have the opportunity to think about how pets affect their lives. Students poll their classmates to find...
Curated OER
Jabberwocky: A Lake and Island Board Project
A mathematical role play using Lake and Island Boards where students plan to move from Jabberwocky to their new planet
Curated OER
Motherhood Math: Mothers in the Workforce
Students evaluate a table showing how the number of working mothers increased between 1955 and 2000. They use the information from the table to complete a worksheet imbedded in this lesson plan.
EngageNY
Drawing a Conclusion from an Experiment (part 2)
Communicating results is just as important as getting results! Learners create a poster to highlight their findings in the experiment conducted in the previous lesson in a 30-part series. The resource provides specific criteria and...
Kenan Fellows
Attack of the Aphids!
Insects threaten the food production industry, and aphids are one of the big players! Analyzing data of aphid populations gives insight into their behaviors. Learners model the population data of an uninhibited population with an...
Curated OER
Graphing Data Brings Understanding
Students collect, graph and analyze data. In this statistics lesson, students use circle, pie, bar and lines to represent data. They analyze the data and make predictions bases on the scatter plots created.
Curated OER
What I Didn't Know...
High schoolers practice creating wikis. In this wiki instructional activity, students create a wiki about any math topic that they know nothing about. High schoolers learn about their topic and create a wiki that explains the math topic...
Curated OER
What Happened to the Mean and Median
Students find the mean, median and mode. In hs statistics lesson, students collect, plot and analyze data. The identify the effect the central tendency have on the data and line.
Virginia Department of Education
Numbers in a Name
What's in a name? Pupils create a data set from the number of letters in the names of classmates. Each group then takes the data and creates a visual representation, such as a histogram, circle graph, stem-and-leaf plot, etc.
Kenan Fellows
Lego Thinking and Building
Run a simulated airplane manufacturing plant with your pupils as the builders! Learners build Lego airplane models and collect data on the rate of production, comparing the number produced to the number defective. Using linear...
American Statistical Association
EllipSeeIt: Visualizing Strength and Direction of Correlation
Seeing is believing. Given several bivariate data sets, learners make scatter plots using the online SeeIt program to visualize the correlation. To get a more complete picture of the topic, they research their own data set and perform an...
Curated OER
Fantasy Baseball Team
Young scholars create a database and use its ability to store, sort, and present information about their fantasy baseball team. They gather information and use their knowledge of statistics to accomplish their team.
Curated OER
Confidence Levels
Students collect data and graph it. In this statistics lesson, students rate confidence levels by collecting data and analyzing it. They graph their findings on the Ti calculator.
Curated OER
Algebra I Project: Make Your Own Business
Students explore the concept of algebra in real world situations. In this economics lesson, students design, plan, run, and evaluate a small business. Students will create a product, market the product, and try to make a profit.
Curated OER
How does Your Province Stack Up?
Learners investigate data about age, and sex of a population. For this statistics lesson, students are given data on a population to analyze and compare to other provinces. This assignment is part of a geography lesson and requires 3...
Curated OER
M&M Math
Pupils sort a bag of M&M candies according to color using a sorting mat. They count M&M candies. They compare the number to their prediction then students create tally charts.
Curated OER
Data Collection and Presentation
Students access how to collect, classify and display data involving statistics. The concepts of quantitative, discrete and continuous data is covered in depth within the lesson. They practice with a scenario of James filled with...
Federal Reserve Bank
Invest in Yourself
What are the different ways that people can invest in their human capital for a better future? Pupils participate in an engaging hands-on activity and analyze data regarding unemployment, the ability to obtain an education, and median...


