Curated OER
Polling and Statistics
Learners investigate polling. For this statistics lesson, students collect data-on polling and graph their data on a coordinate plane. They identify biased and non-biased polling.
Curated OER
Something Fishy (Statistics)
Students are introduced to a problem involving an environmental issue. They are introduced to the capture-recapture method which involves capturing fish, tagging them, returning them and recapturing another sample. Pupils work in...
Curated OER
Exploring Data Sets and Statistics in Baseball
Students explore the concept data sets. In this data sets lesson, students find the 5 number summaries for salaries of teachers and compare them with 5 number summaries of professional baseball players. Students use box and...
Curated OER
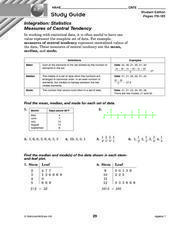
Integration: Statistics
For this math worksheet, students find the mean, median and mode for 6 number sets. Students then find the median and mode for data found in 2 stem-and-leaf plots.
Curated OER
Interpreting Data and Statistics using Graphs
Seventh graders interpret data. In this lesson on types of graphs, 7th graders construct, interpret, and analyze different graphs. This lesson includes worksheets and resources.
Curated OER
Confidence Intervals: Population Mean; Population Standard Deviation Unknown
In this confidence interval worksheet, students examine given statistical information to find the margin of error. They construct a confidence interval for the population and find the mean. Seven statistical problems are available on...
Curated OER
Energy Conservation Lesson 1: Fossil Fuels and the Ticking Clock
Students explore energy production by participating in a class discussion. In this renewable energy instructional activity, students discuss the differences between solar, coal, wind and fossil fuel energy sources and why some are better...
Curated OER
Agricultural Statistician
Pupils explore how statistics effect their daily lives. They discuss how statistical data is collected for the purposes of agriculture.
Curated OER
Is the Rainbow Fair?
Third graders perform statistical calculations. Given a bag of Skittles, 3rd graders sort and collect data regarding the colors included in their bag. Using spreadsheet software, students create a bar graph of the information collected....
Curated OER
Confidence Intervals: Population Proportions
In this interval worksheet, students examine given data to construct a confidence interval for a specified proportion. They also identify the minimum sample size needed to support the required margin of error around the population. Seven...
Curated OER
What's Your Shoe Size? Linear Regression with MS Excel
Learners collect and analyze data. In this statistics instructional activity, pupils create a liner model of their data and analyze it using central tendencies. They find the linear regression using a spreadsheet.
Curated OER
Interpreting Data and Statistics
Students define random sample and complete surveys. In this algebra lesson, students create surveys and define the way people analyze these results. They discuss random sample as it relates to the Great Depression and come up with their...
Curated OER
The Impact
Learn about the destruction of the rainforest by analyzing statistics. Young learners make an original line graph showing destruction in the rainforest. Additional activities include making a collage, sequencing Dr. Seuss' The...
Curated OER
ACC Basketball Statistics
Students use math skills and create a spreadsheet. In this statistics and computer skills lesson, students gather ACC basketball statistics, convert fractions to decimals and then percents. Students use the gathered information to create...
Curated OER
Writing a Newspaper-Style Article
Help your secondary reader/writers assess texts by studying press releases from Statistics Canada and drafting articles based on them. They then compare the press release, their own articles, and actual news stories they find online. I'd...
Curated OER
Scatter-Brained
Seventh graders graph ordered pairs on a coordinate plane. They create a scatterplot. Additionally, they determine the line of best fit and investigate the slope of the line. Multiple resources are provided. An excellent resource!
Curated OER
Past and Present: Using baseball statistics to teach math
Students use baseball cards to add up batting average and reinforce math skills. In this batting averages lesson plan, students use old baseball cards to practice different math skills and look at other baseball statistics.
Curated OER
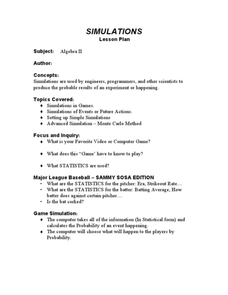
Simulation and Statistics
Students perform simulation of video games as they explore statistics. In this algebra lesson, students relate concepts of statistics and data collection to solve problems. They decide their next step based on the previous assessment of...
Curated OER
A Statistical Look at Jewish History
Students complete their examination over the Jewish Diaspora. Using population figures, they discover the importance of percentages in exploring trends. They use their own ethnic group and determine how it is represented in the United...
Curated OER
Introduction to Population Statistics
Students examine population statistics. In this population instructional activity, students navigate the Internet to locate Canadian statistics regarding population.
Curated OER
Weather and Climate Statistics
The investigation of weather, and climate is a fascinating study. For this lesson, learners see how weather and climate are actually two very different areas of study. They study printouts of an areas temperature highs, lows, and average...
Curated OER
Quick Stats with Quick Poll
Learners analyze data using bar graphs and the TI in this statistics lesson. They investigate quick polls and graph the data using different properties of statistics. This assignment requires a TI Navigator.
Curated OER
Infusing Equity Vs Gender into the Classroom
Students explore the effect of gender bias in the classroom. In this statistics lesson, students discuss the effects of stereotyping, discrimination, and gender bias in the classroom. They collect data on different work places dealing...
Curated OER
Infusing Equity Gender into the Classroom
Students investigate if gender makes a difference in the classroom. In this statistics activity, students collect data on whether equity by gender in the classroom makes students more successful.
Other popular searches
- Data, Census, & Statistics
- Probability and Statistics
- Educational Statistics
- Baseball Statistics
- Math Statistics
- Climate Statistics
- Math Lessons Statistics
- Median and Mean Statistics
- Statistics Lesson Plans
- Sports and Statistics
- Probability Statistics
- Black Plague Statistics


