Kenan Fellows
Applying Linear Regression to Marathon Data
It's not a sprint, it's a marathon! Statistic concepts take time to develop and understand. A guided activity provides an opportunity for individuals to practice their linear regression techniques in spreadsheet software. The activity...
Curated OER
Successful Resource-based Learning Strategies for the Geography of Canada Course
Students conduct a statistical research project on population changes. They evaluate demographic issues, such as the size and location of native people. immigrant groups, and the age and gender of the population.
Curated OER
Shooting Stats
Eighth graders discover the important role statistics play in sports and that appropriate data must be collected to do a statistical analysis. Students practice calculating statistics by charting a professional player of their choice.
Curated OER
An Investigative Task
Students read an article about statistics. In this statistics instructional activity, students are given a detailed overview about statistics and what it entails. This instructional activity is more informational and hands on.
Curated OER
Math League Baseball: Five Week Project
Eighth graders analyze how to use statistics, change fractions to decimal, and graph their statistics. They draft players from Major League Baseball eams and chose on player for each position, including 3 oufielders and one designated...
Curated OER
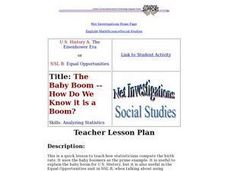
The Baby Boom -- How Do We Know it is a Boom?
Young scholars examine graphs of three statistics and use basic math to compute their own. They evaluate the implications of manipulating data and whether statistics are appropriate for creating policy.
Curated OER
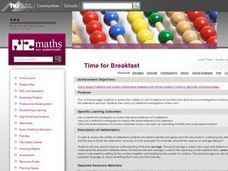
Time For Breakfast
This unit encourages students to assess the validity of a set of statements and then plan and carry out investigations to find out whether the statements are true. Students then carry out statistical investigations of their own.
Curated OER
Compare Your Air
Middle schoolers will compare the data for different locations that they select and investigate trends over the course of a number of years. This will give the students an opportunity to apply statistical measures (mean, median,mode) to...
Curated OER
Discovering Demographics
Young scholars analyze demographic data including a statistical overview of India. Students synthesize their findings and create an informational poster about India.
Curated OER
You Are What You Eat (High School)
Students evaluate data from a statistical chart or graph which they find in a newspaper or magazine.
Curated OER
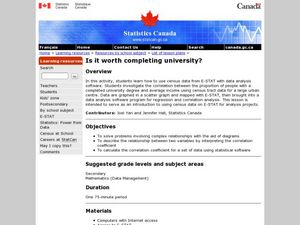
Completing University
Students analyze the pros and cons of completing a 4 year school. In this statistics lesson, students complete surveys and use E-STAT to graph their data. They learn to plot and build diagrams.
Curated OER
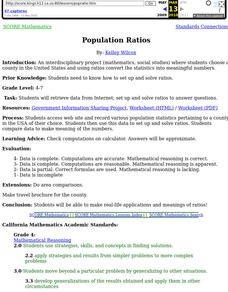
Population Ratios
Students access web site and record various population statistics pertaining to a county in the USA of their choice. They use this data to set up and solve ratios. They compare data to make meaning of the numbers.
Curated OER
Sample This
Students gain a greater understanding of how statistical samples are conducted by taking polls of specific populations. These polls be expressed in graphs, which be compared with the same questions asked of other populations.
Curated OER
Dating Practices
Students interpolate, extrapolate, and make predictions from given information. They present results and conclusions from given data using basic statistics. Pupils create a survey from a critical question and decide which sampling...
Curated OER
Using Current Data for Graphing Skills
Students graph demographic information. In this graphing lesson plan, students choose what type of graph to create and what information to display. Links to examples of graphs and statistical data are provided. The graphs are created on...
Curated OER
Fire Fighting Crew
Students use the concepts in statistics to make decisions. They calculate the mean, median and mode. They compare one firefighter against another and analyze the data. They share their information with the class.
Curated OER
Statistical Analysis of Data by Gender
Students examine and identify gender bias, stereotyping, and discrimination in school materials, activities, and classroom instruction. They apply descriptive statistics knowledge to real-world data.
Curated OER
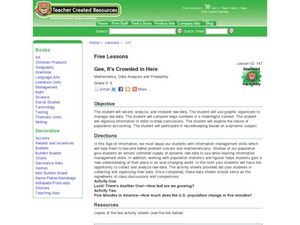
Gee, It's Crowded in Here
Young scholars interpret raw data about population statistics. In this raw data lesson plan, students plug the data into graphic organizers and draw conclusions based on their findings.
Curated OER
Beginning Statistical Inquiries into the Scientific Method: Jelly-Side-Down
Students describe what happens when a piece of jellied toast is dropped off a table. From these observations, students pose a question concerning which side of the jellied toast land on the floor.
Curated OER
Global Warming Statistics
Students research real-time and historic temperature data of U.S. and world locations, and analyze the data using mean, median, and mode averages. They graph the data and draw conclusions by analyzing the data. A spreadsheet is used to...
Curated OER
Graphing Statistics & Opinions About Pets
Students explore how to use a double bar graph by polling other students about their feelings and experiences with pets. They also have the opportunity to think about how pets affect their lives. Students poll their classmates to find...
Curated OER
Functions and Statistics: International Space Station: Up to Us
Learners explore how the International Space Station was built and how it provides first-hand experiences with the space program. They view the NASA engineers discussing the major components of the International Space Station, their...
Curated OER
Math Lesson: What Do You Want to Know? - Country Statistics
Students are able to identify the characteristics of a variety of graphs (i.e. bar graph, line graph, pie graph, scatter plot, population pyramids, etc.) They recognize how the type of data to be presented plays a role in choosing the...
Curated OER
Data Scavenger Hunt
Eighth graders discuss how data is collected and participate in data collection through a survey. They complete a scavenger hunt on the Internet to gain understanding of the data measures mean, median, mode, and range.
Other popular searches
- Data, Census, & Statistics
- Probability and Statistics
- Educational Statistics
- Baseball Statistics
- Math Statistics
- Climate Statistics
- Math Lessons Statistics
- Median and Mean Statistics
- Statistics Lesson Plans
- Sports and Statistics
- Probability Statistics
- Black Plague Statistics


