Curated OER
Statistics Canada
Students practice using graphing tools to make tables, bar charts, scatter graphs, and histograms, using census data. They apply the concept of measures of central tendency, examine the effects of outliers. They also write inferences and...
Curated OER
What Is A Rate? Practice Sheet
Your mathematicians practice expressing rates with ratios. They identify from among 12 ratios the ones that are unit rates. They express six given situations as two equal rates each. Finally, they interpret data about fuel efficiency...
Curated OER
Averages: Mean, Median, Mode
After reviewing the process of finding the mean, median, mode, and average of a given data set, learners work through several practice problems. There are five problems related to mode, and five related to finding the mean. Great as...
Alabama Department of Archives and History
A Worse Death: War or Flu?
In a lesson that integrates history and mathematics, class members create graphs that compare military death statistics from World War I with those that resulted from the influenza pandemic of 1918.
Scholastic
Study Jams! Range
Zoe just bought a bunch of CDs and wants to know the range of the prices she paid for them. Follow along and learn how to find the range of a data set by simply subtracting the largest and smallest numbers. Guided and independent...
Scholastic
Study Jams! Median
Zoe is curious how many goals her soccer team usually scores in a game. To answer the question, she walks through the process of finding the median of a data set in this step-by-step presentation. Examples are included that model how to...
Scholastic
Study Jams! Mean/Average
Join Zoe as she calculates the average number of points RJ scored in his basketball games. This step-by-step presentation clearly models the procedure for finding the mean of a data set, including examples with both whole number and...
Smarter Balanced
Food Waste and Food Access
Forty percent of food in the US goes uneaten while 14.5 percent of US households lack a secure supply of food. As part of the preparation for a performance task assessment, groups consider statistics such as these about food waste and...
Balanced Assessment
The Contest
Good advertisers can make mathematics seem irrelevant. Teach your classes to use math to see through these tactics and make good decisions. The posed task has pupils analyze sweepstakes statistics to determine and compare the cost of...
EngageNY
Sampling Variability
Work it out — find the average time clients spend at a gym. Pupils use a table of random digits to collect a sample of times fitness buffs are working out. The scholars use their random sample to calculate an estimate of the mean of the...
University of Richmond
Foreign-Born Population 1850-2010
If America is a nation of immigrants, where are they from and why did they come? Demographic data and interactive maps help pupils consider answers to these questions by examining the statistics of foreign-born Americans. Features allow...
Curated OER
Famous People: Teacher Notes
Young statisticians practice creating scatter plots. First, they estimate the age of 14 people. Next, they write down the estimate in a table labeled x. Then write down their actual age in the table labeled y. Using these x and y...
Curated OER
Most Likely/Least Likely
Learners consider a practice problem which prompts them to choose the type of marble most likely to be picked out of a group. Then, they answer probability-type questions regarding a spinner, and a tally chart of coins.
Illustrative Mathematics
Accuracy of Carbon 14 Dating II
The scientific issue of carbon-14 dating and exponential decay gets a statistics-based treatment in this problem. The class starts with a basic investigation of carbon content, but then branches out to questions of accuracy and...
Centers for Disease Control and Prevention
Tobacco Use and Secondhand Smoke Exposure Is High in Multiunit Housing
Much has been written recently about the danger of secondhand smoke. Laws have been passed to limit that exposure in offices, transportation centers, and public areas. But what about apartment buildings, condos, public housing, and other...
Curated OER
Baseball Math
Students collect data on baseball plays. In this statistics lesson plan, students graph their data and make predictions based on their observation. They calculate what the probability is that a favorable outcome would happen.
Curated OER
Gender Equity in the Classroom
Students review employment statistics and wages over the past 20 years. They examine the Federal Work Force Laws. They apply formulas to find the rate of change in the minimum wage.
Curated OER
Making Math Meaningful in March Madness
Young scholars examine the statistics of March Madness, the college basketball tournament. They watch videotaped basketball games to collect data for further analysis using Word and Excel. They analyze the data in a variety of activities...
Curated OER
Walking on Air
Young scholars collect and analyze data with a graph. In this statistics lesson plan, students use central tendencies to find the meaning of their data. They display the data on a Ti calculator.
Curated OER
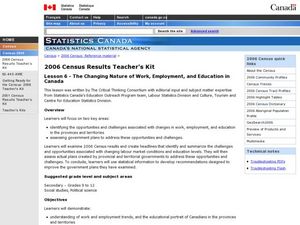
The Changing Nature of Work, Employment, and Education in Canada.
Students identify the effect caused by change of employment and education. In this statistics lesson, students analyze data and draw conclusions. This assignment tests students' ability to use data correctly.
Curated OER
Mr. Cobbler's Shoe Dilemma
Pupils employ statistics to solve real-world problems. They collect, organize and describe data. They make inferences based on data analysis. They construct, read, and interpret tables, charts and graphs.
Curated OER
Gathering, Recording, and Presenting Data
Sixth graders use the local newspaper to find and discuss examples of uses of statistics and the ways in which the information is presented. They create and represent their own set of data showing how students get to school each day.
Curated OER
Analyzing Country Data
Students analyze different data in percentage form. In this statistics lesson, students plot data using box-plots, dotplot, and histogram. They compare and contrast the collected data using the boxplot.
Curated OER
Assessing Normalcy
Learners define normal distribution as it relates to the bell curve. In this statistics lesson, students use the central tendencies of mean, median and mode to solve problems. They plot their data and draw conclusion from the graphs.
Other popular searches
- Data, Census, & Statistics
- Probability and Statistics
- Educational Statistics
- Baseball Statistics
- Math Statistics
- Climate Statistics
- Math Lessons Statistics
- Median and Mean Statistics
- Statistics Lesson Plans
- Sports and Statistics
- Probability Statistics
- Black Plague Statistics


