Hi, what do you want to do?
Curated OER
The Statistical Nature of Test Data
Students investigate the properties of various metals. They conduct an experiment and gather the data by putting into the proper statistical graphs. The data is analyzed and conclusions are formed according to the properties of the metals.
Curated OER
Statistical Analysis For Graphing Calculators
Students analyze date from the Chesapeake Bay. Using a graphing calculator, they enter the data, plot three temperatures, and create a Box and Whisker plot.
Curated OER
US Historical Climate: Excel Statistical
Students import US Historical Climate Network mean temperature data into Excel from a station of their choice. They are guided through the activity on how to use Excel for statistical calculations, graphing, and linear trend estimates.
Curated OER
Snowboarding! Join the U.S. Team: Olympics, Math, Weather
Young scholars make weather predictions and observations, research the cost of snowboarding equipment, and use their math skills to plot the course of a Giant Slalom Snowboarding event.
Curated OER
Descriptive Statistics
Students demonstrate how to use frequency and scatter diagrams. In this statistics instructional activity, students are introduced to different techniques of representing data. Students sort and graph data on a worksheet and use a...
Curated OER
Measures of Central Tendency
In this Algebra I worksheet, 9th graders determine the measures of central tendency for a given data set. The one page worksheet contains four problems. Answers are provided.
Curated OER
Infusing Equity Gender into the Classroom
Students investigate if gender makes a difference in the classroom. In this statistics lesson plan, students collect data on whether equity by gender in the classroom makes students more successful.
Curated OER
Algebra 2/Trigonometry Regents Exam
Students review for the Regents Exam. In this math lesson, students review core concept for the Regents exam by working a variety of problems. A printable worksheet is provided.
Curated OER
English Vocabulary Skills: AWL Sublist 8 - Exercise 3b
In this online interactive English vocabulary skills instructional activity, learners answer 10 matching questions which require them to fill in the blanks in 10 sentences. Students may submit their answers to be scored.
Thinkport Education
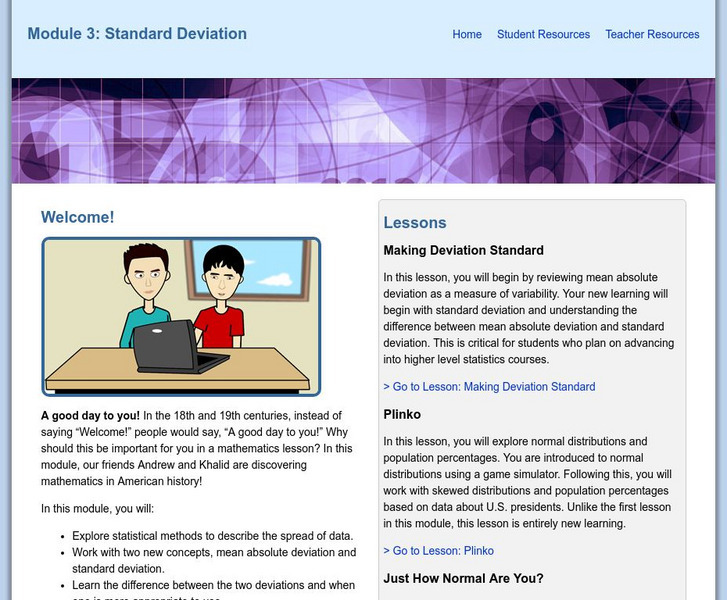
Thinkport: Algebra Ii: Standard Deviation
Begin by reviewing mean absolute deviation as a measure of variability. Your new learning will begin with standard deviation and understanding the difference between mean absolute deviation and standard deviation.
Other
Vlps: Mean and Standard Deviation
Explanation of frequency distributions, mean, standard deviations, and variance including a Java Applet.
Google
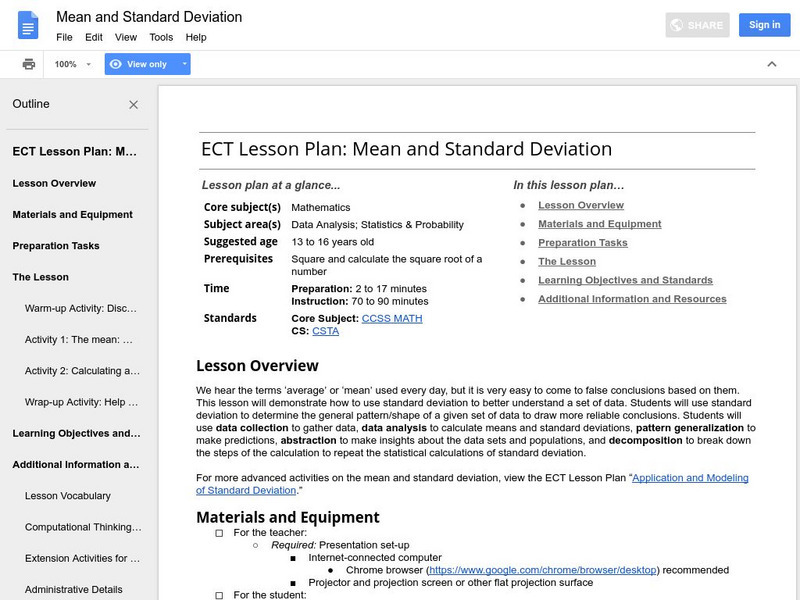
Google for Education: Mean and Standard Deviation
This lesson demonstrates to students how to use standard deviation to better understand a set of data. Students use standard deviation to determine the general pattern or shape of a given set of data to draw more reliable conclusions.
Wolfram Research
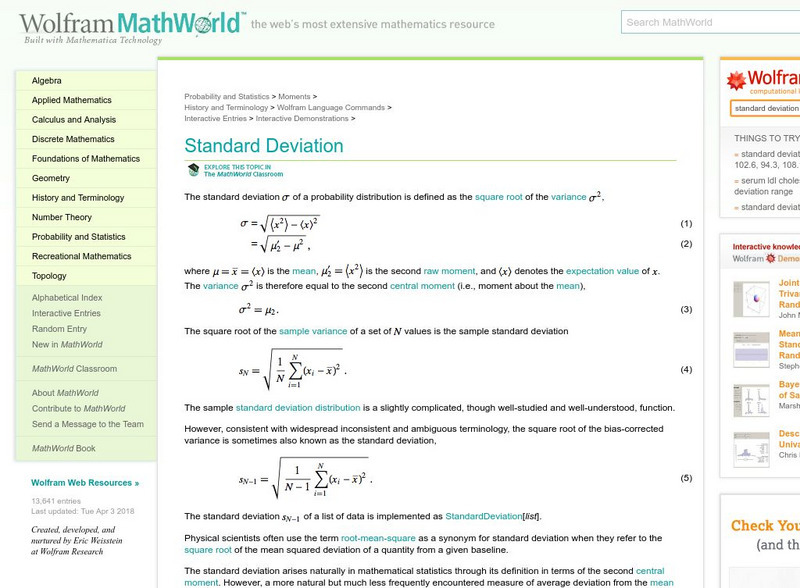
Wolfram Math World: Standard Deviation
This World of Mathematics site by Eric Weisstein explains the term "Standard deviation." Provides step-by-step help, examples, and charts.
Michigan Technological University
Computing Mean, Variance and Standard Deviation
Page centered around a computer program to determine mean, variance, and standard deviation.
Science Education Resource Center at Carleton College
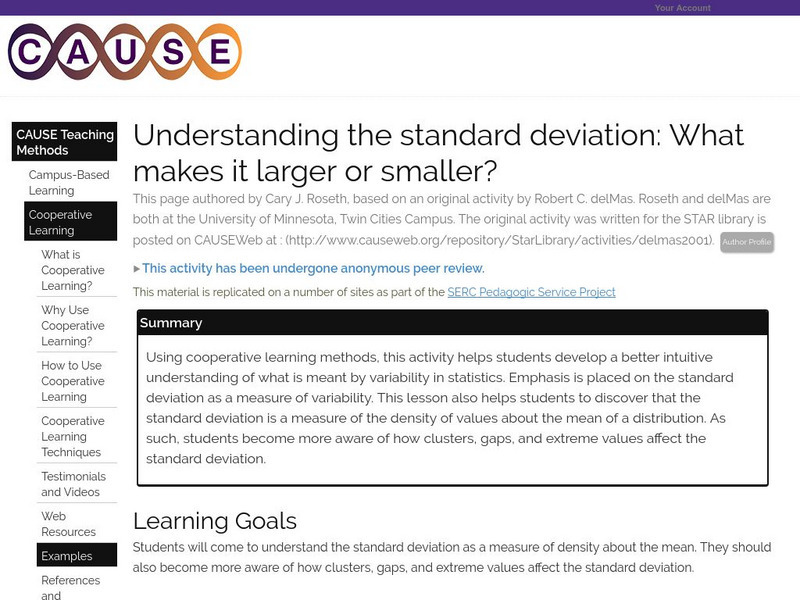
Serc: Understanding the Standard Deviation: What Makes It Larger or Smaller?
Learners develop a better intuitive understanding of what is meant by variability in statistics. Emphasis is placed on the standard deviation as a measure of variability.
Stefan Warner and Steven R. Costenoble
Finite Mathematics & Applied Calculus: Mean, Median & Standard Deviation
Students learn about mean, median, variance, and standard deviation. The tutorial investigates the statistics concepts though class notes and examples. Review exercises are included.
Missouri State University
Missouri State U.: Statistics: Measures of Central Tendency and Variability
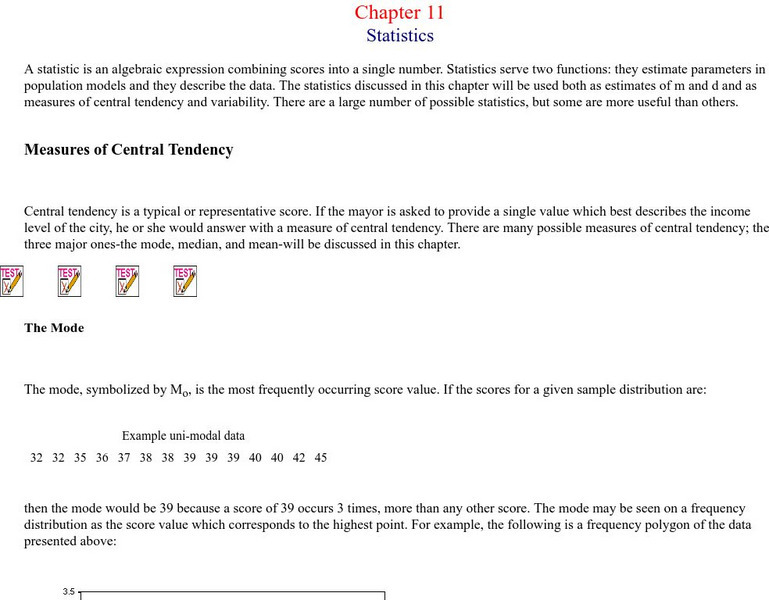
Provides lengthy explanations of the measures of central tendency - mean, mode, and median - and the measures of variability - range, variance, standard deviation. Graphs of interesting examples are presented as well, skewed...
CK-12 Foundation
Ck 12: Mean and Standard Deviation of Discrete Random Variables
[Free Registration/Login may be required to access all resource tools.] This Concept teaches students how to find the mean and standard deviation for discrete random variables.
Calculator Soup
Calculator Soup: Standard Deviation Calculator
Standard deviation is a statistical measure of diversity or variability in a data set. A low standard deviation indicates that data points are generally close to the mean or the average value. A high standard deviation indicates greater...
Vision Learning
Visionlearning: Statistics: Using Mean, Median, and Standard Deviation
An introduction to recognizing trends and relationships in data through descriptive statistics.
Illustrative Mathematics
Illustrative Mathematics: S Id Sat Scores
Students will find solutions for a series of questions based on the assumption that SAT mathematics scores for a particular year are approximately normally distributed with a mean of 510 and a standard deviation of 100. Explanation and...
Illustrative Mathematics
Illustrative Mathematics: Measuring Variability in a Data Set
The purpose of this student task is to develop understanding of standard deviation. Aligns with S-ID.A.2 and S-ID.A.3.
Missouri State University
Missouri State University: Introductory Statistics: Statistics
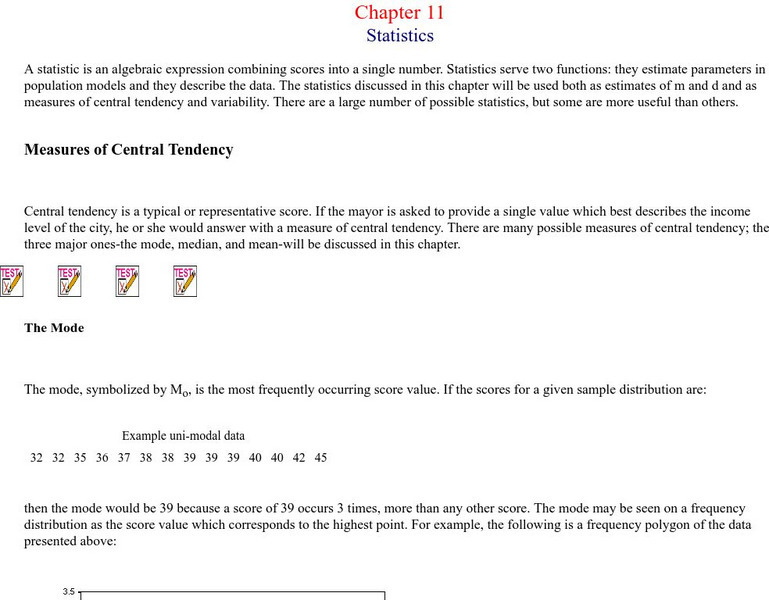
This is an excellent resource on what the science of statistics involves. There are all kinds of definitions, examples, graphs, and charts to learn from. The topics covered include: mode, mean, median, skewed distributions and measures...
Calculator Soup
Calculator Soup: Descriptive Statistics Calculator
This is a statistics calculator; enter a data set and hit calculate. Descriptive statistics summarize certain aspects of a data set or a population using numeric calculations. Examples of descriptive statistics include: mean, average,...


