Illustrative Mathematics
Velocity vs. Distance
At the end of this activity, your number crunchers will have a better understanding as to how to describe graphs of velocity versus time and distance versus time. It is easy for learners to misinterpret graphs of velocity, so have them...
101 Questions
Stopping Distances
In 2016, one in every four fatal car crashes listed speeding as a contributing factor. Pupils view videos of a car trying to come to a quick stop from four different rates of speed. They use context clues to measure and determine the...
National Council of Teachers of Mathematics
Varying Motion
For this secondary mathematics learning exercise, high schoolers collect data based on a person’s motion. From this data, learners create graphs comparing displacement, velocity, and acceleration to time. The five-page learning exercise...
MENSA Education & Research Foundation
Roller Coaster Mania!
Raise the energy level of your physical science class with this exciting hands-on activity. Applying their knowledge of kinetic and potential energy and Newton's laws of motion, young engineers use foam tubing and marbles to create...
Curated OER
Braking Distance
This real-life model of braking distance motivates learners to approach quadratic equations algebraically, numerically, graphically, and descriptively.
Physics Aviary
Physics Aviary: Practice Problems: Finding Speed From Work Graph
Students must determine the speed of a hockey puck based on a graph of force vs. displacement.
Physics Aviary
Physics Aviary: Graphing Motion Problem Level 4
Find out the instantaneous velocity based on a position vs. time graph.
Physics Aviary
Physics Aviary: Graphing Motion Problem Level 1 Part 2
Students are finding the relative velocity between two objects using a position vs. time graph.
Texas Instruments
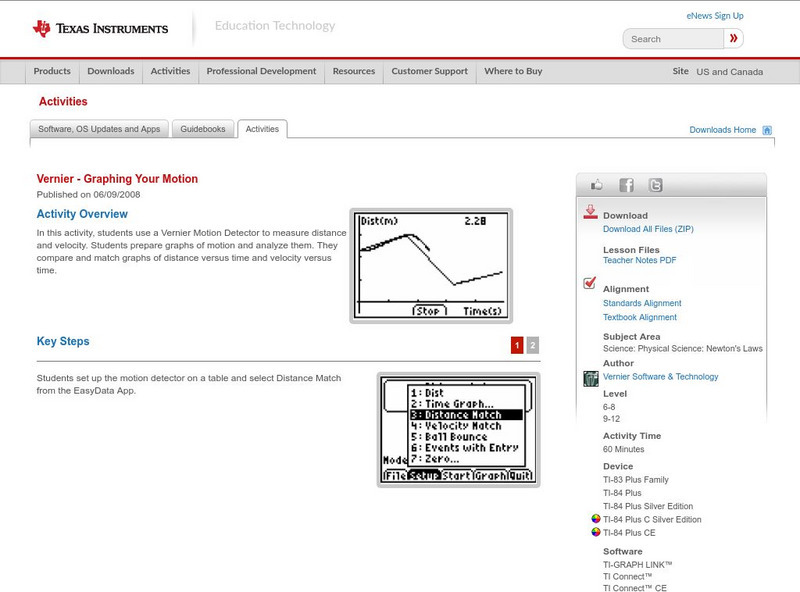
Texas Instruments: Graphing Your Motion
In this activity, students use a Motion Detector to measure distance and velocity. Students prepare graphs of motion and analyze them. They compare and match graphs of distance versus time and velocity versus time.
Physics Aviary
Physics Aviary: Graphing Motion Problem Level 1
Students are finding the velocities of objects based on the position vs. time graphs they create.
Other
Institute of Physics: Practical Physics: Speed Time Graphs to Find an Equation
An illustrated example of a speed-time graph plotted with speed on the vertical axis against time on the horizontal axis.
Physics Aviary
Physics Aviary: Graphing Motion Problem Level 3
Find the displacement of an object just by looking at the velocity vs. time graph. This graph will have at least one negative region and one positive region.
Texas Instruments
Texas Instruments: Graphing Motion: Instantaneous and Average Speed
Students are introduced to the calculator as a graphing tool and distinguish between average speed and instantaneous speed.
Science Education Resource Center at Carleton College
Serc: Analyzing the Motion of a Marble Down a Ramp
This lab activity involves rolling a marble down a ramp where the students can investigate constant acceleration motion. The students then make a position vs. time graph and a velocity vs. time graph in order to investigate the change in...


