PBS
The Lowdown — Poverty Trends: What Does It Mean to Be Poor in America?
Here's a resource that's rich with learning opportunities. Future mathematicians investigate the poverty rate in America over time. They use an interactive to compare the poverty rate during the Great Recession of 2008 to other years,...
Illustrative Mathematics
Introduction to Linear Functions
Introduce your algebra learners to linear and quadratic functions. Learners compare the differences and relate them back to the equations and graphs. Lead your class to discussions on the properties of a function or a constant slope...
Curated OER
Race The Rapper: Slopes
Students calculate the slope of the equation For this algebra lesson, students graph coordinate pairs of linear equations and identify the relationship between x and y values and slope. They differentiate between functions and...
Curated OER
Slopes of Lines
Learners examine a graph and relate it to the real world situation it depicts. They investigate changes in an equation and the appearance of a line. They investigate the connection between the graph of a situation and the meaning of the...
Curated OER
Baseball Relationships - Using Scatter Plots
Students use graphing calculators to create scatter plots of given baseball data. They also determine percentages and ratios, slope, y-intercepts, etc. all using baseball data and statistics.
Curated OER
Exploring the Slopes of Parallel and Perpendicular Lines
Students calculate the slope of parallel and perpendicular lines.In this algebra lesson, students differentiate between parallel and perpendicular lines. They graph their lines using the slope of the equation.
Curated OER
Exploring the Slopes of Parallel and Perpendicular Lines.
Students find the slopes for perpendicular and parallel lines. In this geometry lesson, students differentiate between parallel and perpendicular lines. They use Cabri software to create lines to compare.
University of Utah
Explore Proportional and Linear Relationships
Progress from proportional relationships to linear functions. Pupils first review concepts of proportionality covered in earlier grades. They then extend these concepts to linear functions, such as determining the slope of a line using...
Mathalicious
Domino Effect
Carryout the lesson to determine the cost of pizza toppings from a Domino's Pizza® website while creating a linear model. Learners look through real data—and even create their own pizza—to determine the cost of each topping. They explore...
Texas Instruments
TI-Nspire™ CAS
When it comes to rating educational calculators, this calculator is always near the top of this list. Now it's available as an app. There is a lot of calculator power wrapped up in this app. Not only is this a fully functioning...
Curated OER
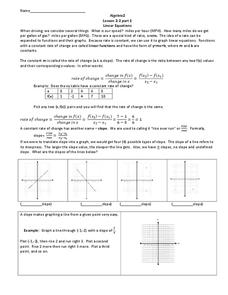
Linear Equations
Pre-algebra pupils examine the rate of change and how we can interpret it as a linear function. They are introduced to slope-intercept equations and graphs. Plenty of instruction is provided along with example problems. Note that even...
Curated OER
Inequalities 7.3
Graph inequalities and discuss the difference in their slopes. Learners observe rate of change as they compare linear, quadratic, and cubic functions.
Curated OER
Mine Shaft Grade 8 Slope
Eighth graders investigate slopes using real life scenario. For this algebra lesson, 8th graders model and interpret real life data. They plot their data in a coordinate plane and discuss the results with the class.
Curated OER
Determination of a Rate Law
Students determine the rate law for a chemical reaction. They use graphical techniques in the analysis of experimental data.
Curated OER
Slope Calculation
Middle schoolers practice calculating the slope of a line. They explain how the formula is derived and identify properties that are associated with positive, negative and undefined slopes. They complete an online activity as well.
Curated OER
Graph Your Motion
Learners graph their linear equations. In this algebra lesson, students examine their lines and relate it to the slope or rate of change. They relate the steepness of the line to the slope being positive, negative or zero.
CCSS Math Activities
Smarter Balanced Sample Items: 8th Grade Math – Claim 2
Math can be a problem in eighth grade. Sample items show how problem solving exists within the eighth grade standards. Part of the Gr. 8 Claim 2 - 4 Item Slide Shows series, the presentation contains eight items to illustrate the...
Charleston School District
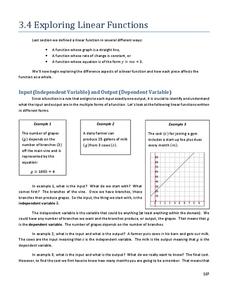
Exploring Linear Functions
What does a graph or equation say about a situation? Lots! The lesson uses the concepts explored in the previous four lessons in the series and applies them to problem solving situations. Learners create an equation from problems posed...
Curated OER
Writing Equations from a Table
Students use coordinates in a table to write equations. For this algebra lesson, students discuss rate of change as it relates to slope and x and y values. They plot the points from a table to graph their lines and write an equation for...
Curated OER
Carshop!
Students explore the concept of interest. For this interest lesson, students shop for cars and determine the payments and interest rates for various cars. Students use various websites to research cars and interest rates for car loans....
Curated OER
Is there Treasure in Trash?
More people, more garbage! Young environmentalists graph population growth against the amount of garbage generated per year and find a linear model that best fits the data. This is an older resource that could benefit from more recent...
Curated OER
Data
Students collect data from an experiment they perform. In this data lesson plan, students use multiple representations to solve practical problems; describe advantages and disadvantages of the use of each representation. Then, they...
Alabama Learning Exchange
We Love to Graph!
Students experience graphing points. In this graphing points lesson, students play an on-line game where they must name 10 coordinate pairs correctly. Students play a maze game where they maneuver a robot using coordinate pairs. ...
Curated OER
Introduction to Tangent Lines using the TI-Nspire
Learners make mathematical argument using the concept of Limit. In this algebra lesson, student calculate the instantaneous rate of change from the linear graph. They use a TI-calculator to create a visual of the graphs.


