Ms. Amber Nakamura's Mathematics Website
Algebra Project
What would your dream house look like? A cottage? A medieval castle? High schoolers enrolled in Algebra design the perfect house while using slopes to write equations for various aspects of the project.
CCSS Math Activities
Smarter Balanced Sample Items: 8th Grade Math – Target C
Target C from the Smarter Balanced assessment for eighth grade is understanding the connections between proportional relationships, lines, and linear equations. A slide show includes items about graphing proportional relationships and...
Curated OER
Calculating Slope
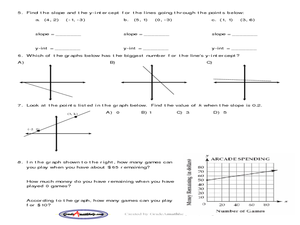
Students find the slope using a slope formula. In this algebra worksheet, students use a pair of coordinate to identify the slope and y intercept. There are 7 questions.
Curated OER
Finding Equations From Graphs
For this equations from graphs worksheet, 9th graders solve and graph 10 different problems that include determining the actual equation for each. First, they determine the slope and y-intercept for each graph shown on the right. Then,...
Curated OER
Comparing Lines with Slope and Y intercept.
Learners compare lines using the slope and y-intercept. In this algebra lesson plan, students analyze linear equations based on their solutions and slope/intercept. They evaluate numbers in the equation to solve for the unknown.
Curated OER
Analyzinf Equations Through Slope and Y intercept
Students solve equations representing exponential functions. In this algebra instructional activity, students interpret their equations by analyzing the slope and y intercept. They find the slope using the slope formula.
Curated OER
AnaLyzing Equations Through Slope and Y Intercept.
Students analyze and solve linear equations. For this algebra lesson, students solve inequalities using the slope and y intercept. They rewrite word problems into algebraic equations and solve for the unknown.
Curated OER
Lines of Fit
Students analyze graphs. In this algebra lesson, students find the line of best fit, using scatter plots. They calculate the sale of popcorn as it relates to the price. They then analyze the graphs for positive, negative and no correlation.
Curated OER
Forces and Graphing
Students analyze graphs to determine relationships between variables and rates of change. They determine the basic concepts about static reaction forces. They determine the slope and equation of a line.
Kenan Fellows
Math Made Simple as 1-2-3: Simplified Educational Approach to Algebra
Writing an equation of a line is as easy as m and b. A lesson presentation gives individuals different strategies for writing equations of lines. Some items provide a slope and a point while others provide two points. Whatever the given,...
Georgetown University
Cup-Activity: Writing Equations From Data
Determine how cup stacking relates to linear equations. Pupils stack cups and record the heights. Using the data collected, learners develop a linear equation that models the height. The scholars then interpret the slope and the...
Virginia Department of Education
Linear Curve of Best Fit
Is foot length to forearm length a linear association? The class collects data of fellow scholars' foot length and the length of their forearms. They plot the data and find a line of best fit. Using that line, they make predictions of...
EngageNY
Designing a Search Robot to Find a Beacon
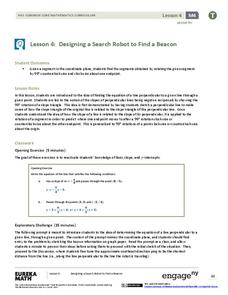
Build right angles using coordinate geometry! Pupils explore the concept of slope related to perpendicular lines by examining 90-degree rotations of right triangles. Learners determine the slope of the hypotenuse becomes the opposite...
Curated OER
Profitable Soda Stand
Am I making any money? Help learners determine if their fictitious soda stand is turning a profit. They graph linear equations using the slope and y-intercept and identify the best price to use to sell soda. They identify the domain and...
American Statistical Association
What Fits?
The bounce of a golf ball changes the result in golf, mini golf—and a great math activity. Scholars graph the height of golf ball bounces before finding a line of best fit. They analyze their own data and the results of others to better...
Curated OER
Texting and Grades II
Given the least squares regression line, interpret the slope and intercept in the context of the relationship between texting and GPA. Although this task is short and looks simple, some subtle points can be brought to light in a...
Curated OER
Graphing Linear Equations with Two Variables
Can your class solve linear equations in two variables? They will be able to after they engage in this lesson. Individuals graph linear equations in two variables using slope and intercept and identifying the relationship between the x...
Curated OER
Linear Equations
In this Algebra I worksheet, students determine the graph of the equation of a line. Students determine the x- and y-intercepts and graph. The three page worksheet contains six problems. Answers are not...
Curated OER
Algebra: Linear Equations
Learners draw graphs of linear equations using the slope intercept form. Upon completion of various problems, students record their answers on the board and explain the solutions to classmates. Learners take a test over the material...
Curated OER
Discovering the Linear Relationship between Celsius and Fahrenheit
Students discover the linear relationship between degrees Farenheit and degrees Celsius. They manually compute the slope and y-intercept of the line passing through points. They convert Celsius to Fahrenheit degrees.
Curated OER
Write the Equation of a Line Given the Slope and a Point
Students write the equation of a line given the slope and y-intercept. In this algebra instructional activity, students are given a point a the line and the slope of the line and are asked to write an equation of the line. They relate...
Curated OER
Slope and Equations of Lines
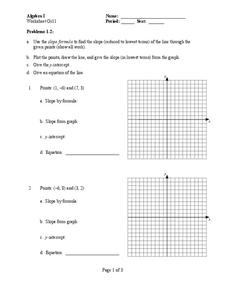
In this slope worksheet, students find the equation of a line given a pair of points or a given slope. Examples are provided at the beginning of this worksheet. There are 20 problems on this two-page worksheet.
Curated OER
Straight Line Graphs
In this math worksheet, students plot lines on a graph paper when given the equation for the line in slope-intercept form. They tell the values of the slope and the y-intercept. Students find the x and y intercepts and plot three lines....
Curated OER
Slope and Tangent
Students differentiate between the slope and the tangent of the horizontal. In this precalculus lesson, students examine slopes created by tangent lines. They observe the angle formed using properties of the unit circle.


