Curated OER
El Nino Lesson
Students compare graphs of weather occurrences. In this environmental lesson plan, students will being using the website to gather weather related information for a certain time period. The students will then graph the data that will be...
Curated OER
How Warm is the Water?
Students research how surface sea temperature changes throughout the year. They draw a time series of sea surface temperatures for each month of the year and a depth profile for a summer and winter month using an OceanExplorer Profiler...
Curated OER
Ocean Impacts of an El Nino Event
Students study sea surface height and temperature and other characteristics of an El Nino. For this ocean impacts lesson students examine the factors that influence an El Nino or La Nina.
NOAA
Climographs
In the second lesson plan of a five-part series, young climatologists use provided temperature and precipitation data to create climographs of three different cities. They then analyze these climographs to develop a general understanding...
Curated OER
Weather, Sea Level Rise and Climate Change Course
Students explain the impact of glacial melting to global climate change. In this environmental science lesson, students design an experiment to investigate the effect of salinity change to melting glaciers. They share their results to...
Curated OER
Is Global Warming Affecting Hurricanes?
In this hurricane worksheet, students use data charts showing the number of hurricanes and the severity of these hurricanes to determine if global warming is causing an increase in hurricanes. This worksheet has 2 short answer questions.
Curated OER
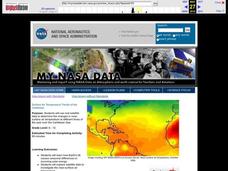
Surface Air Temperature Trends of the Caribbean
Students investigate the seasonal changes to sea surface and near-surface air temperatures near the equator. They use actual satellite data to track and graph the differences in air and sea temperatures during different seasons in the...
Curated OER
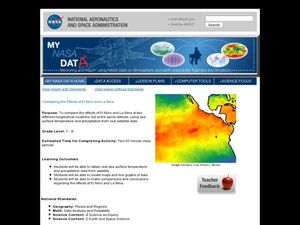
Comparing the Effects of El Nino and La Nina
Students examine the differences between an El Nino and La Nina year. For this investigative lesson students create maps and graphs of the data they obtained.
NOAA
History's Thermometers
How is sea coral like a thermometer? Part three of a six-part series from NOAA describes how oceanographers can use coral growth to estimate water temperature over time. Life science pupils manipulate data to determine the age of corals...
Curated OER
Hurricane Strength: Spatial Association of Wind Speed and Water Temperature
In this hurricane worksheet, students read and analyze satellite images of hurricane Rita. They complete 4 short answer questions about it.
Curated OER
How Much CO2 Gas Can Sea Water Hold?
Students explain the relationship between water temperature and gas concentration. Using a graph, they describe how sea surface temperature changes along with the seasons. They develop a hypothesis and test it by graphing and analyzing...
Curated OER
Fostering Geospatial Thinking: Space to Earth: Earth to Space (SEES)
Students locate and access data to help them with their science inquiry. In this geographical positioning lesson students evaluate and compare data sets.
Curated OER
Teacher's Guide For: Water Temperature and Salinity Experiment
Students experiment with water density, temperature and salinity. In this water lesson, students observe how the coldest water sinks to the bottom of a test tube, and how saltwater sinks in comparison to freshwater.
National Wildlife Federation
Ghost Town
Around 93 percent of the reefs on Australia's Great Barrier Reef have been bleached, and almost one quarter of them are now dead. Scholars research the sea temperatures, especially around the areas with coral reefs, to make connections...
Curated OER
Properties of Fresh and Sea Water
Learners work with three stations to demonstrate the properties of water. They explore water's boiling point, freezing point, and its ability to store heat.
Curated OER
The Air Around You
In this air worksheet, students will answer questions about the Earth's atmosphere, including the layers, air masses, and heat transfer. Students will explore how the difference in atmospheric temperature can create weather patterns....
Curated OER
Ocean Streams
The instructions for demonstrating ocean turnover are provided in this resource. You could set this up for your earth science class as part of a lecture on convection currents or as an explanation of how ocean currents form. An animation...
Curated OER
Coral Bleaching in the Caribbean
Students use authentic satellite data on the NASA website to determine when the sea surface temperature meets the criteria to induce coral bleaching.
Curated OER
Science: Hurricanes As Heat Engines
Young scholars conduct Internet research to track the path of Hurricane Rita. They record the sea surface temperature of the Gulf of Mexico during and after the hurricane and draw conclusions about how hurricanes extract heat energy...
Curated OER
Stronger Hurricanes
Students explore hurricanes, the factors that contribute to them, and the role warmer sea surface temperatures may have on them. They perform experiments to observe energy transfer. Students explore the possible causes and effects of...
Curated OER
Introduction to Remote Sensing
Students view, discuss, and compare different types of maps produced from remote sensing data. They use image processing software to analyze and enhance sea surface temperature maps.
Curated OER
Upwelling in the World Ocean
Here is a fascinating topic: the upwelling of ocean waters. Oceanography pupils learn what mechanisms cause upwelling, types of upwelling, and the effects on marine life. Colorful satellite imagery and informative diagrams bring this...
National Wildlife Federation
Wherefore Art Thou, Albedo?
In the sixth lesson in a series of 21, scholars use NASA data to graph and interpret albedo seasonally and over the course of multiple years. This allows learners to compare albedo trends to changes in sea ice with connections to the...
Curated OER
Climate Change
Rising sea levels, strong storms, melting ice ... who or what is to blame? Scholars browse the website in preparation for a class discussion or debate about whether human activity is causing climate change. They gain a balanced...


