PBS
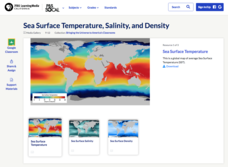
Sea Surface Temperature, Salinity, and Density
Earth's vast ocean is full of mysteries! Science scholars discover the big-picture properties that influence its characteristics at different latitudes using a lesson from PBS's Weather and Climate series. After completing a background...
Curated OER
Ocean Currents and Sea Surface Temperature
Students use satellite data to explore sea surface temperature. They explore the relationship between the rotation of the Earth, the path of ocean current and air pressure centers. After studying maps of sea surface temperature and ocean...
Curated OER
Fish and Zooplankton Through Remote Sensing
Ecology aces examine sea surface temperature maps and relate temperatures to concentration in fish and zooplankton populations. Take your class to a computer lab and provide experience with actual remote sensing data. Some of the links...
Curated OER
Lesson #6: Sea Surface Temperature and Coral Bleaching
Fifth graders examine the concept of coral bleaching and sea surface temperature. They view a teacher demonstration, interpret sea surface temperature data, explore a website, and complete worksheets.
NOAA
Graphing Temperatures
Battle of the hemispheres? In the fourth installment of a five-part series, young oceanographers use the NOAA website to collect temperature data from drifters (buoys), one in the Northern Hemisphere and one in the Southern Hemisphere....
NASA
Inferring Relationships Among Sea Surface Salinity & Other Variables in the North Atlantic
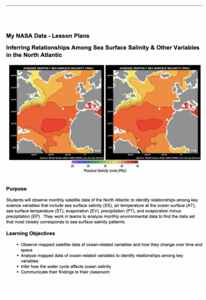
Some say a picture is worth a thousand words—even from a hundred miles away! Learners review satellite data to analyze ocean variables such as temperature, salinity, evaporation, and precipitation. They look for patterns in the data and...
California Academy of Science
Global Climate Change and Sea Level Rise
Ice is nice, and its condition on the planet has a significant effect. Junior geoscientists experiment with ice melting in both water and on land to discover how each affect the rising sea level. This detailed lesson outline even...
Curated OER
Changing Planet: Sea Levels Rising
Begin by showing a six-minute video, Changing Planet: Rising Sea Level as an anticipatory set. Pupils draw a topographic map of a potato continent. Finally, they will visit NOAA's sea levels online map and NASA's carbon dioxide...
Curated OER
Sea Surface Temperature Trends of the Gulf Stream
Learners use authentic satellite data to produce plots and graphs of sea surface temperature as they explore the seasonal changes of the Gulf Stream.
NOAA
Ground-truthing Satellite Imagery with Drifting Buoy Data
Ground-truthing ... is it even a word? The last installment of a five-part series analyzes how scientists collect sea surface temperature data. Scholars use government websites to compare temperature data collected directly from buoys...
Curated OER
Sea Water Mixing and Sinking
Students investigate the role of temperature and salinity in determining seawater density. They use a Temperature-Salinity Diagram to examine the effects of mixing on density.
Curated OER
Ocean Circulation
In this physical oceanography PowerPoint, viewers learn about ocean circulation, sea surface temperatures, and salinity. Relationships among these aspects are explained, as well as their impact on the atmosphere and climate. Each slide...
Curated OER
Sea Surface Temperature Trends of the Gulf Stream
Students explore the importance of the Gulf Stream. Using a NASA satellite images, they examine the sea surface temperature. Students collect the temperature at various locations and times. Using spreadsheet technology, they graph the...
Curated OER
Hurricanes As Heat Engines
Young scholars examine sea surface temperatures to see how hurricanes get heat from the oceans surface. In this hurricanes lesson students use the Internet to find data and make line plots.
Curated OER
Coral Bleaching in the Caribbean
Students practice analyzing images, maps and graphs from Internet-based educational resources. They explore the correlation between sea surface temperature and coral bleaching. Students comprehend that coral reefs are collections of tiny...
Curated OER
Sea and Ice Salinity
Students conduct an experiment. In this salinity lesson, students learn about sea ice, why it is important and how changing amounts can affect the sea. Students conduct an experiment to find out the effects of salinity on the formation...
Curated OER
Whales and Sea Ice: Investigating Insulation
Young scholars investigate the properties of insulation as it relates to whales and sea ice. They research whales and examine the atmospheric changes that occur when there are changes in sea ice.
Curated OER
Ocean Circulation
Students view and analyze buoy, satellite, temperature vs depth data to study about ocean circulation and how is related to atmospheric circulation. They read and interpret satellite image data related to: Surface wind speeds, Wave...
Curated OER
Causes and Effects of ENSO
Students analyze monthly sea surface temperature data from the Pacific Ocean to determine if the period is an El Nino or a normal year. They recognize signs to see if there are any patterns that signal either occurrence. Satellite images...
Curated OER
Phytoplankton in the Gulf of Maine
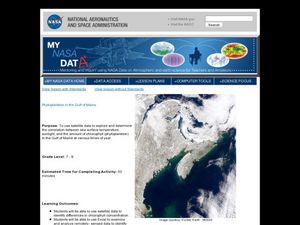
Students use satellite data to see the correlation between sea temperature and sunlight in the Gulf of Maine. In this phytoplankton lesson students use Excel to analyze data.
NOAA
Understanding El Niño Using Data in the Classroom
Are weather troubles caused by El Nino? An installment of a larger series presents a five-part lesson on El Nino. First, scholars learn to read sea surface temperature maps. Then, they compare them to data on graphs before determining if...
Curated OER
Surface Air Temperature Trends of the Caribbean
Students use real satellite data to determine the changes in near-surface air temperature at different times of the year over the Caribbean Sea. They discover how Earth's tilt causes seasonal differences in incoming solar energy. They...
NASA
The Big Climate Change Experiment Lesson 3: Climate Change Lines of Evidence
Consider the preponderance of evidence when making a verdict. The third of five lessons in Unit 1: The Big Climate Change Experiment focuses on the evidence for climate change. Learners study graphs, diagrams, and pictures regarding...
Curated OER
Weather, Sea Level Rise and Climate Change
Students differentiate weather and climate. In this earth science lesson plan, students compare weather and climate in different regions of the world. They interpret weather graphs and compare isotherm lines of northern and southern...


