American Museum of Natural History
Field Trip Earth
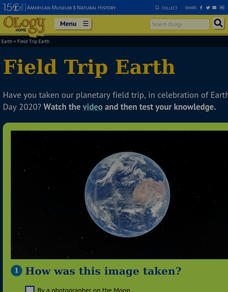
Take a field trip around Earth by way of satellite images. Learners watch a video lesson that describes different images taken from orbiting satellites. They then test their visual skills in a 14-question online quiz.
Curated OER
Who's Range is it?
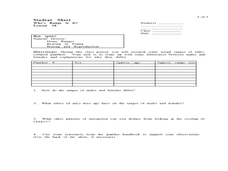
Students investigate the habits of panthers by analyzing radio transmitted data. In this animal life lesson, students utilize computers to view the range of different statistics dealing with Florida panthers. Students complete a...
Curated OER
FILLING IN THE GAPS - Acquiring and Analyzing Satellite and Ground-Based Data
Students monitor rainfall, compute daily averages, and compare their methods of computation to those used by actual researchers using satellite observations.
NOAA
How Do We Know?: Make Additional Weather Sensors; Set Up a Home Weather Station
Viewers learn about three different weather measurement tools in installment five of the 10-part Discover Your Changing World series. They build weather vanes to collect data on wind speed, barometers to determine air pressure, and rain...
Curated OER
Data Corruption by High-Energy Particles
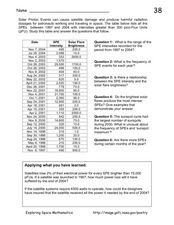
In this data corruption by high-energy particles, students solve 4 problems about the solar flare that corrupted the imagers measuring them. Students find the speed of the arriving particles and the percentage of light-speed the...
Curated OER
Ozone and Temperature Data Analysis, South Pole Antarctica
Young scholars discuss the layers of the atmosphere, and the history of the ozone hole. They discuss the chemistry of the ozone formation. Students compare seasonal data collected with ozonesondes. They compare Antarctic and Arctic ozone...
Curated OER
Imagers: The Adventure of Echo the Bat Number to Pictures: How Satellite Images are Created
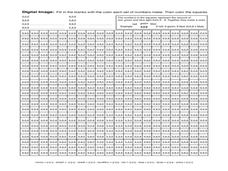
Students examine the three primary colors of light and design a numerical code to represent those colors. They tell how satellites use numbers to create satellite images after completing a number of experimental activities.
Curated OER
Biology Project: Gone Fishing
Students write a scientific article using data and prediction skills. In this scientific writing lesson, students access data about fishing off the coast of New Jersey. They look at satellite data, fluorometry and CTD data over a 3 -4...
Curated OER
Correlation of Variables by Graphing
Middle and high schoolers use a spreadsheet to graph data. In this graphing lesson, learners determine how two parameters are correlated. They create a scatter plot graph using a computer spreadsheet.
NASA
Precipitation
Here is a fabulous collection of lessons for your emerging meteorologists! In them, learners will utilize satellite data to determine distribution of rainfall, research global rainfall patterns, and utilize their knowledge to propose new...
Curated OER
The Global Precipitation Measurement Mission (GPM) Lesson
Introduce your class to one of the ways that technology is benefiting humanity. The Global Precipitation Measurement Mission involves the data collected by nine satellites from different countries with a united focus on studying world...
NASA
Ascent: 50 Seconds to MECO
All systems go! With a video and a Google Earth tour as background, pairs investigate two graphs. The graphs display acceleration vs. time and velocity vs. time of a space shuttle launch. Using graphing calculators, the pairs take a...
Curated OER
Comparison of Snow Cover on Different Continents
Students use the Live Access Server (LAS) to form maps and a numerical text file of snow cover for each continent on a particular date and analyze the data for each map, corresponding text file to determine an estimate of snow cover for...
Curated OER
How Much Water Is Available In The Atmosphere For Precipitation?
Learners explore the relationship between the available water in the atmosphere and how it is portrayed on satellites. After examining global moisture and precipitation students research precipitation data graph the results. Using their...
Curated OER
Satellite Technology
In this satellite technology worksheet, students read about Low Earth Orbit satellites and the frictional drag from the Earth's atmosphere that causes them to fall back towards the Earth. Students use given data of the years the...
Curated OER
Annotating Change in Satellite Images
Students construct a movie using Landsat images to observe changes over time on Earth. In this satellite images lesson, students observe changes in land use over time and document one type of change they observe. They produce an...
Curated OER
Solar Cell Energy Availability From Around the Country
Students determine areas that are the most likely to produce solar energy by using NASA data. In this solar energy lesson plan students analyze plots and determine solar panel use.
Curated OER
Solar Proton Events
On this worksheet, space scientists use a data table to answer questions about the relationship between the brightness of solar flares and the intensity of the solar proton events. They apply what they learned from the data to address...
Curated OER
Analyzing Tree Rings to Determine Climate Change
Students examine how to locate and access data sets. In this climate change instructional activity students import data into Excel and graph it.
NOAA
Tracking a Drifter
Be shore to use this drifter resource. The third installment of a five-part series has learners using the NOAA's Adopt-a-Drifter website to track to movement of a drifter (buoy) in the ocean. Graphing the collected data on a map allows...
Curated OER
Differences Between Ground and Air Temperatures
Students examine the differences between air temperature and ground temperature. For this investigative lesson students find NASA data on the Internet and use it to create a graph.
Curated OER
Comparing the Effects of El Nino and La Nina
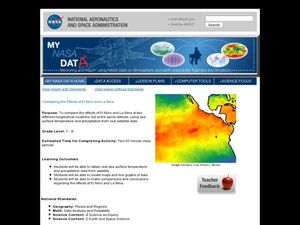
Students examine the differences between an El Nino and La Nina year. In this investigative lesson students create maps and graphs of the data they obtained.
Curated OER
Think GREEN - Utilizing Renewable Solar Energy
Students use data to find the best renewable energy potential. In this solar energy lesson students import data into Excel and explain how solar energy is beneficial.
Curated OER
Does cloud type affect rainfall?
Student use MY NASA DATA to obtain precipitation and cloud type data. They create graphs of data within MY NASA DATA. Students compare different cloud types, compare precipitation, and cloud type data They qualitatively describe graphs...


