Texas Instruments
Texas Instruments: Da Vinci's Proportions
This activity is designed to help students work with linear regression models, error, correlation coefficients and coefficients of determination. In this activity students not only deal with the mathematical concepts of regression but...
CK-12 Foundation
Ck 12: Applications of Function Models
[Free Registration/Login may be required to access all resource tools.] A collection of resources for exploring word problems using function models.
Texas Instruments
Texas Instruments: Exponential Models and Logarithmic Scales
In this activity, students will analyze exponential growth data and then switch to a logarithmic scale. Includes both an exponential and a linear regression on the data, and asks students to make connections between two forms of...
Texas Instruments
Texas Instruments: Finding Linear Models
Students graph a scatter plot, find average rate of change, develop a linear model, find a linear regression and a median/median line for a set of data graphed in a scatter plot and predict profit.
Wikimedia
Wikipedia: Linear Regression
Wikipedia explains the statistics term, "linear regression." Includes table of contents, hyperlinked terms, and formulas.
Texas Instruments
Texas Instruments: Predicting White Blood Counts
Students find equations, which best-fit the data, using different regression models built into their calculators. The best method of handling this data, is to break the data into sections and fit different periods of time with different...
Texas Instruments
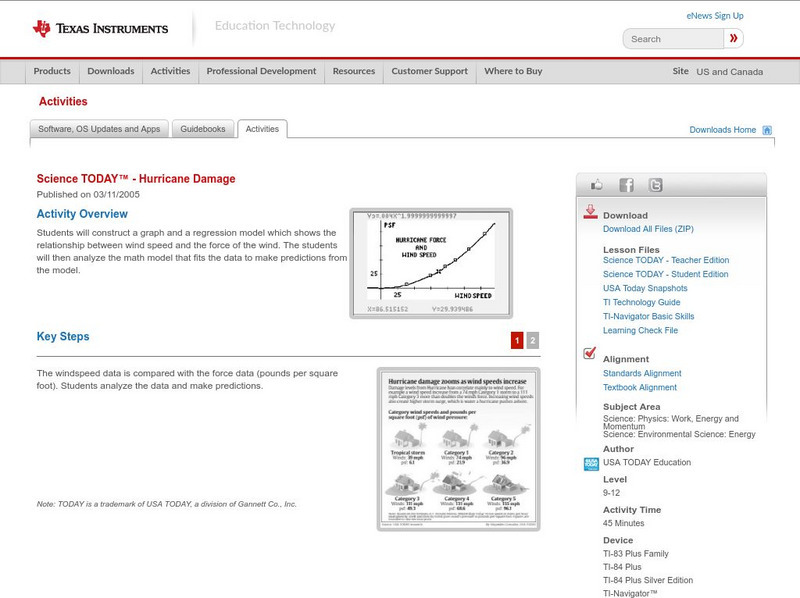
Texas Instruments: Science Today Hurricane Damage
Students will construct a graph and a regression model which shows the relationship between wind speed and the force of the wind. The students will analyze the math model that fits the data to make predictions from the model.
Texas Instruments
Texas Instruments: Growing Babies
In this activity, students observe and graph data about human fetal growth rates. Students build a regression model based on the data and compare values with those of other mammals. They also compare the data to non-mammal species.
Texas Instruments
Texas Instruments: The River of Life
In this activity, students compare human body mass with blood volume. They graph the data and build a regression model. They estimate their own blood volume and also predict volumes of blood for other animals.
TeachEngineering
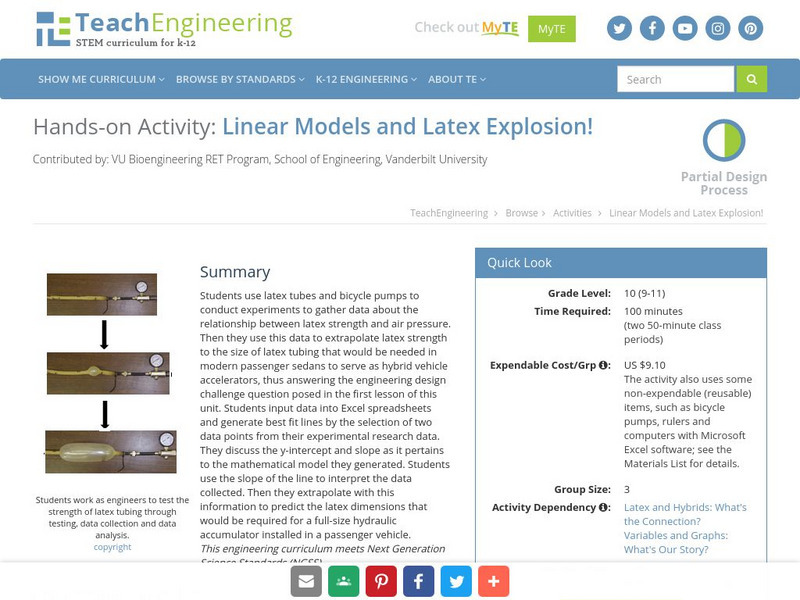
Teach Engineering: Linear Models and Latex Explosion!
Students use latex tubes and bicycle pumps to conduct experiments to gather data about the relationship between latex strength and air pressure.
CK-12 Foundation
Ck 12: Algebra: Applications of Function Models
[Free Registration/Login may be required to access all resource tools.] In this lesson students draw a scatter plot of data, find and draw the function that best fits that data, and make predictions from that information. Students watch...
Stefan Warner and Steven R. Costenoble
Finite Mathematics & Applied Calculus: Topic Summaries: Linear Functions and Models
The topic summary outlines linear functions and models. Some topics reviewed are domain, mathematical model, slope, and linear regression. The resource consists of definitions, notes, and examples.
Texas Instruments
Texas Instruments: Numb3 Rs: Exponential Modeling
Based off of the hit television show NUMB3RS, this lesson introduces students to exponential equations, their graphs, and their application in the real world. The lesson is framed in the context of the number of cell phone users for a...
Wolfram Research
Wolfram Math World: Linear Regression Model
A basic definition for what linear regression is can be found here. Examples of forms of linear regression are also given.
TeachEngineering
Teach Engineering: Latex Tubing and Hybrid Vehicles
This unit gives students the opportunity to make use of linear models in order to make predictions based on real-world data. Students experience how engineers address incredible and important design challenges through the use of linear...
Math Graphs
Houghton Mifflin: Math Graphs: Line of Best Fit 15 [Pdf]
The practice problem explores the validity of the line of best fit and a linear regression model created on a graphing calculator. The given points are available in PDF format.
Math Graphs
Houghton Mifflin: Math Graphs: Line of Best Fit 16 [Pdf]
The practice problem explores the validity of the line of best fit and a linear regression model created on a graphing calculator. The given points are available in PDF format.
Math Graphs
Houghton Mifflin: Math Graphs: Line of Best Fit 17 [Pdf]
Students calculate a linear regression model using a graphing calculator. The given points are available in PDF format.
Math Graphs
Houghton Mifflin: Math Graphs: Line of Best Fit 18 [Pdf]
Students calculate a linear regression model using a graphing calculator. The given points are available in PDF format.
ClassFlow
Class Flow: Fitting Models to Data
[Free Registration/Login Required] A basic premise of science is that much of the physical world can be described mathematically and many physical phenomena are predictable. This scientific outlook took place in Europe during the late...
Texas Instruments
Texas Instruments: Ball Bounce
This activity allows students to use real data obtained by them to model quadratic equations. students can use the TI-83 and/or TI-84 and a motion detector to collect their data. The students will then manually fit both quadratic and...
Math Graphs
Houghton Mifflin: Math Graphs: Line of Best Fit 13 [Pdf]
Students investigate the line of best fit and the regression feature of a graphing calculator. The example consists of a math graph with given points that are available in PDF format.
Math Graphs
Houghton Mifflin: Math Graphs: Line of Best Fit 14 [Pdf]
Students investigate the line of best fit and the regression feature of a graphing calculator. The example consists of a math graph with given points that are available in PDF format.
Math Graphs
Houghton Mifflin: Math Graphs: Line of Best Fit 9 [Pdf]
The practice problem has learners sketch a line of best fit, create a linear model, and compare both lines on a calculator. The given points are available in PDF format.









![Houghton Mifflin: Math Graphs: Line of Best Fit 15 [Pdf] Unknown Type Houghton Mifflin: Math Graphs: Line of Best Fit 15 [Pdf] Unknown Type](https://d15y2dacu3jp90.cloudfront.net/images/attachment_defaults/resource/large/FPO-knovation.png)

