National Security Agency
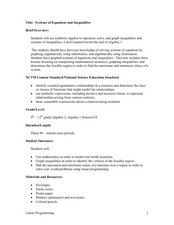
Systems of Equations and Inequalities
High school classes can use manipulatives too! Offer hands-on, interactive lessons that venture away from the typical day in your algebra class. Young mathematicians will be involved in collaborative learning, visual representations, and...
Visa
Pro Lesson Module — Financial Football
Learners won't fumble their knowledge of personal finance after an engaging game of Financial Football! As they choose their favorite teams and desired plays, young economists demonstrate their financial literacy with a question ranging...
Radford University
Got Slope?
Go around and around with slope. The class investigates tornadoes by watching videos, building a homemade tornado, and performing research on the Storm Prediction Center website. Groups gather data and create scatter plots for twisters...
Curated OER
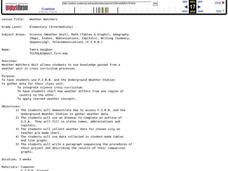
Weather Watchers
Learners are introduced to an Underground Weather Stations. In groups, they use the internet to research the weather in different parts of the United States locating each city. To end the lesson, they summarize the information they...
Curated OER
Great Graphs
Students create graphs by tabulating their preferences among 10 state quarters. They examine quarters and tally their favorites. They complete a worksheet. There are more lesson plans included in this unit.
Curated OER
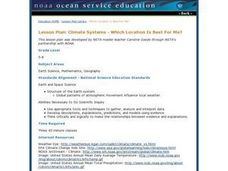
Climate Systems - Which Location Is Best For Me?
Students study the difference between weather and climate. For this climate systems lesson students search the Internet for the parts of the Earth's system, gather climate data and complete a challenge scenario.
Curated OER
In the Bag!
Students calculate how many quarters are in a $1,000 bag (after learning the dollar value of filled coin bags). They explain their problem-solving strategy using pictures, numbers, equations, and/or words.
Curated OER
Cruisin' the Counties: Learning Counties and Major Roads in Arizona
Pupils examine Arizona counties and use the themes of location and movement to develop an Arizona map.
Curated OER
Magnetic Forces and Kinetic Energy
In this magnetic forces and kinetic energy instructional activity, students use the formula that relates the speed of an electron in a plasma cloud to its energy to find the speed of 6 different plasma cloud electrons. They answer 5...
Curated OER
Onwards and Upwards
Students analyze a graph representing college tuition increases, consider the possible causes and consequences of these tuition increases and collect data on tuition changes at colleges in the United States by region and graph the data.
Practical Money Skills
Making Decisions
A set of quizzes and assessments would make a great companion to your instructional activity on making decisions and opportunity risks. Learners watch a PowerPoint before answering multiple choice questions about interest rates, saving...
Curated OER
Charting History With Pennies
Young scholars collect pennies and sort them in ascending order of dates. For the year on each penny, students research key events in history and pick a single event, explaining its historical significance. Then young scholars use these...
Curated OER
Linear Programming
In this algebra worksheet, students calculate the maximum and minimum of a shaded region. They identify the boundaries and their vertices's. There are 2 problems.
Curated OER
Places and Production
Young scholars calculate United States GDP and GDP per capita, use a choropleth map to acquire information, and create choropleth maps of GDP per capita in South America. They identify regions with high and low GDP per capita
Curated OER
Did Voters Turn Out -- or Are They Turned Off?
What was the voter turnout at your last state election? Examine voter turnout statistics from the most recent election to learn which ten states have the best turnout record. This lesson offers election data, handouts, and worksheets.
Curated OER
50 State Quarter Game
Learners, using their knowledge of place value and number sense, play this counting game in small groups, or as a whole class, to see who be the first person to reach 50 cents.
Mathematics Vision Project
Module 5: Modeling with Geometry
Solids come in many shapes and sizes. Using geometry, scholars create two-dimensional cross-sections of various three-dimensional objects. They develop the lesson further by finding the volume of solids. The module then shifts to finding...
Curated OER
Where in the Usa is Radon?
Pupils determine the areas of New Jersey and the US that are likely to have high radon concentrations. Students draw a map of their own neighborhood that show soil associations in their neighborhood.
Curated OER
A Measuring Adventure
Students practice measuring items. In this measurement lesson, students read the book Measuring Penny and create their own system of measurement. Students measure various items in the classroom, using their creative measurement system.
Curated OER
Eighteenth and Nineteenth Century Natural Dyes
Second graders explore the work of Americans when it came to coloring materials. In this interdisciplinary instructional activity, 2nd graders follow the provided steps to make natural goldenrod dye from scratch.
Curated OER
Westward Expansion
Learners locate California and New York on a map and explore available means of travel in the 19th century. Students explore the role of trade in pioneer America and simulate various barter transactions.
Curated OER
Aldridge Sawmill -- The Story in Numbers
Seventh graders view a recent transparency of the average rainfall zones of the state of Texas. Using another transparency, they identify the Piney Woods subregion of the Gulf Coastal Plain and locate national forests and sawmills. ...
Curated OER
The Many Faces of Coins
Students examine and discuss the designs on the circulating coins produced by the United States Mint. They read about the woman and child featured on the Golden Dollar. They compare and contrast coins using a Venn Diagram.
Curated OER
Bald Eagle Population Graphing
Students create graphs to illustrate the bald eagle population. They identify the population of bald eagles in Minnesota and the United States. They create three graphs to represent the population data including a line, bar, and...


