Curated OER
A Reading Graph
Students construct and interpret a "favorite classroom books" graph. For this literacy and math graphing lesson, students choose a reduced size copy of the book cover that corresponds with the book(s) they chose to read during their...
Math Worksheets Land
Pie or Circle Graphs - Matching Worksheet
It's one thing to be able to read a pie graph, but it's another to analyze a pie graph and match it to its data table. Use a multiple choice worksheet when challenging learners to practice this skill. With six data charts and pie graphs,...
Curated OER
Use a Graph Practice 4.8
What do you like to do after school? Study this bar graph and have learners answer the five questions that follow. Consider asking learners to draw their own bar graph for number five (even though the question can be answered without...
Curated OER
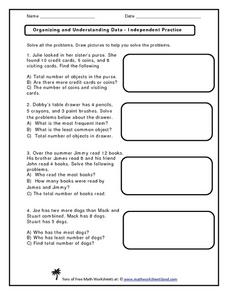
Organizing and Understanding Data - Independent Practice
Provide your first graders with an opportunity for independent practice organizing and understanding data. The ten story prompts on this three-page activity asks learners to solve problems involving concepts of the total number of...
Curated OER
Wind Effects- A Case Study
Learners explore hurricanes. For this weather data interpretation lesson, students draw conclusions about the impact of Hurricane Floyd as it related to weather conditions. Learners read and interpret a tide data table, a barometric...
EngageNY
Comparing Linear Functions and Graphs
How can you compare linear functions? The seventh installment of a 12-part module teaches learners how to compare linear functions whose representations are given in different ways. They use real-world functions and interpret features in...
Macmillan Education
Sine and Cosine Graphs
Learners compare and contrast sine and cosine graphs in order to describe their characteristics in a collaborative activity. As they explain their reasoning, learners strengthen their writing and vocabulary skills associated with sine...
Curated OER
Star Reading
Learners of all ages discover the importance of reading fluently by viewing celebrities reading children books and telling about their personal paths to fluency. They participate in a fluency reading routine that connects them with a...
Curated OER
Collect and Organize Data - Practice 14.1
In this data collection worksheet, students read the word problem and study the tally chart about favorite sports. Students then use the information in the chart to answer the questions. Students then use the list about students'...
EngageNY
The Graph of the Natural Logarithm Function
If two is company and three's a crowd, then what's e? Scholars observe how changes in the base affect the graph of a logarithmic function. They then graph the natural logarithm function and learn that all logarithmic functions can be...
Curated OER
After Reading: "Plot the Plot" Activity in the Library Media Class
"Plot the plot" of "The Adventures of the Speckled Band" with your young readers. Take a few days to read Sir Arthur Conan Doyle's short story as a class or in pairs, having learners write down what they consider to be the most important...
Curated OER
Graphs and Functions
Middle schoolers describe plotting functions on the Cartesian coordinate plane. They solve functions on paper and using an online tool to plot points on a Cartesian coordinate plane creating lines and parabolas.
National Museum of the American Indian
The A:Shiwi (Zuni) People: A Study in Environment, Adaptation, and Agricultural Practices
Discover the connection of native peoples to their natural world, including cultural and agricultural practices, by studying the Zuni people of the American Southwest. This instructional activity includes examining a poster's...
Curated OER
Rockefeller's Revenge: Exxon and Mobil Unite
Study the impact and possible outcomes of the Exxon-Mobil merger in your language arts, social studies, or economics class. Secondary learners evaluate a series of graphs, write a paragraph interpreting the data, and engage in class...
Curated OER
The Mitten
Explore the Ukraine through a reading of The Mitten. Readers will determine the sequence of events, cause and effect, make predictions, and find the main idea of the story. They also use math skills to make charts and graphs. Finally,...
Curated OER
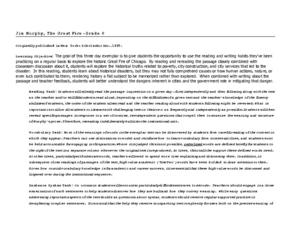
Jim Murphy, The Great Fire - Grade 6
The Great Fire by Jim Murphy provides the text for a study of the Chicago fire of 1871. The plan is designed as a close reading activity so that all learners have the same background information require for writing. Richly detailed, the...
Curated OER
Graphing Race Results
Fifth graders graph bike mileage results. In this graphing information lesson, 5th graders get into groups, and organize the information they read. Students share how they organized the information with the rest of the class. Students...
Polar Trec
How Much Data is Enough?
The next time you read a magazine or watch the news, make note of how many graphs you see because they are everywhere! Here, scholars collect, enter, and graph data using computers. The graphs are then analyzed to aid in discussion of...
Chicago Botanic Garden
Plant Phenology Data Analysis
Beginning in 1851, Thoreau recorded the dates of the first spring blooms in Concord, and this data is helping scientists analyze climate change! The culminating instructional activity in the series of four has pupils graph and analyze...
Balanced Assessment
Movie Survey
Movie preferences will get your classes talking! Individuals read a pie graph and construct a bar graph using the same information. They then answer questions specific to the data and sample size.
Institute of Electrical and Electronics Engineers
Coloring Discrete Structures
What's the least number of colors needed to color a U.S. map? The lesson plan begins by having pupils view a video clip on continuous and discrete phenomenon, then launches into an activity reminiscent of Zeno's paradox. A separate video...
Curated OER
Study Buddies: Reading Line Graphs
In this math worksheet, students will work with a coach to solve a problem by reading a line graph. Students will follow a step-by-step process and notes are provided for the coach.
Curated OER
Fruit Loop Graphing
Fifth graders interpret data and create graphs. Given Fruit Loops, they sort and classify according to color. Using spreadsheet technology, 5th graders record their data and create bar and circle graphs. Students analyze data and...
Curated OER
All About Graphs
Students practice organizing data by creating graphs. For this statistics lesson, students survey the class about favorite colors and create a bar graph using the data. Students complete a test based on pet and animal statistics.


