Curated OER
Air Quality
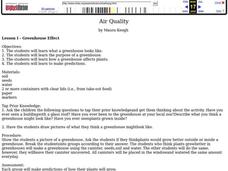
Learners participate in many activities examining air quality. They examine the purpose of a greenhouse and make predictions. They also collect data and make graphs and charts.
Curated OER
The Hat
Honing reading and communication skills through the theme of farm animals is the focus of this lesson plan. Students read a book about Scandinavian farm animals and complete prediction journal activities. They complete a worksheet about...
Curated OER
It's Raining Cats and Dogs! Literary Devices and Figurative Language
Third and fourth graders study literary devices and figurative language. They view a PowerPoint presentation (which you must create) to review hyperbole, idiom, simile, and metaphor. They read and discuss the book There's A Frog in...
Curated OER
Geography With Dr. Seuss
Students read the book, The King's Stilts by Dr. Seuss and discuss the geographical information given in the book. Then they discuss and locate on a map the physical features that make up the continent of Africa. They create an original...
Curated OER
Fame, Fortune, and Philanthropy
With your middle schoolers, develop concepts such as philanthropy, civic responsibility, community service, and common good. Discuss famous philanthropists and what we can each give of our time, talent and treasure to better our...
Curated OER
Sea Changes: A New England Industry
Students conduct research in order to use primary and secondary sources. They interpret and analyze information from textbooks and nonfiction books for young adults, as well as reference materials, audio and media presentations, oral...
Curated OER
Organizing and Interpreting Data
For this organizing and interpreting data worksheet, students solve and complete 10 different problems related to reading various data tables. First, they complete the 3 charts shown with the correct tally amount, frequency amount, and...
Curated OER
Plotting Wind Speed and Altitude
Young scholars construct, read and interpret tables, charts and graphs. They draw inferences and develop convincing arguments that are based on data analysis. They create a graph displaying altitude versus wind speed.
Curated OER
Laurence Yep's Dragonwings
Students read independently the novel, "Dragonwings," by Laurence Yep and make connections between a text and the world. They summarize, paraphrase, analyze and evaluate skimming and scanning techniques when reading a novel. Each student...
Curated OER
Climographs
Learners identify trends and characteristics of climate zones and specific places within. Then, they graph annual climate trends (primarily Temperature and Precipitation) and create, interpret and extrapolate information based on...
Curated OER
Laurence Yep's, Dragonwings
Students discuss vocabulary words and compare definitions. They read chapters 6-9 of the novel, Dragonwings, and discuss point of view, and complete a plot diagram. Then they review the four types of conflict and identify the conflicts...
Curated OER
The Sun Affects Earth
Third graders read, write, and listen to information about the sun and its effects on the Earth.as it relates to its axis, orbit, rotate, and revolution. In this solar system lesson, 3rd graders examine how the sun...
Curated OER
Map Reading
After examining a map from 1803 and 2003, they explore how to become map readers. They describe what they see on the map from 1803 and compare the information to the map from 2003. Students create their own map of the neighborhood that...
Curated OER
Reading Trees: Understanding Dendrochronology
Students examine tree-ring dating and discuss the lack of water the settlers in Jamestown faced. They create paper tree rings, simulate rain patterns, and describe the history of construction paper tree sequences.
Mark Twain Media
Understanding Informational Text Features
Everything you need to know about informational text features can be found in this resource. Recognizing these types of text features and how they are used in text allows readers to better understand information. Teachers...
EngageNY
TASC Transition Curriculum: Workshop 12
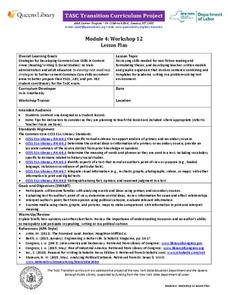
How can opinions slant facts? Workshop participants learn how to examine primary and secondary sources and identify the author's point of view. They also examine how visual art impacts the meaning and rhetoric of sources. Full of...
Channel Islands Film
Cache: Lesson Plan 2 - Grades 4-6
Class members will dig this activity that has them trying their hand at recovering artifacts. Groups are assigned a section of a sandbox, carefully uncover the artifacts in their section, and then develop theories about who might...
Virginia Department of Education
Mineral Identification
What's the difference between a rock and a mineral? And what properties are used to identify minerals? The first installment of a five-part series on earth materials and processes prompts young scientists to identify a set of...
Open Text Book Store
Arithmetic for College Students: Worksheets
Loaded with concepts ranging from multiplying decimals to converting units to solving problems using the order of operations, a thorough practice packet is perfect for a fifth or sixth grade math classroom.
Curated OER
Virtual Field Trip
Are we there yet? Young trip planners learn about their state and plan a trip. They will select sites to see in three cities in their state, and record associated costs in a spreadsheet. While this was originally designed as a...
Curated OER
Telecommunications and the Whole Language Program
Young writers use technology and other media to research information on a chosen topic. They explore countries where keypals and e-mail friends are located. Using their writing skills, they correspond with their e-mail friend and...
Curated OER
Do You Want To Learn more Aobut QC Planning Tools?
Young scholars explore scientific graphs and charts. They describe the origin of power curves and examine QC procedures. Students calculate critical-size errors that are medically important. They read OPSpecs charts. Young scholars...
Curated OER
"Favorite Fairy Tale Characters"
Third graders enter the results of their survey on a spreadsheet. They construct a bar graph showing the results.
Curated OER
Count The Letters
Students perform activities involving ratios, proportions and percents. Given a newspaper article, groups of students count the number of letters in a given area. They use calculators and data collected to construct a pie chart and bar...


