Curated OER
Growing Rock Candy
Students observe the growth of rock candy. In this crystal growth instructional activity, students make rock candy and measure the crystal growth over five days.
Curated OER
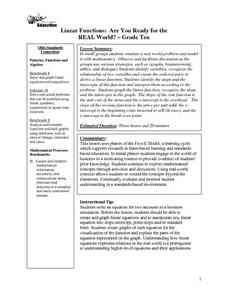
Linear Functions: Are You Ready for the REAL World?
students emulate a real world problem and model it with mathematics working in a small group. Observe and facilitate discussion as the groups use various strategies, such as (graphs, brainstorming, tables, and dialogue.
Curated OER
The Numbers Behind Hunger #1
Students investigate world hunger. In this global issues lesson plan, students research world hunger issues using the World Food Program website. Students analyze statistics and consider how to address word hunger issues.
Pennsylvania Department of Education
Analyzing Numeric and Geometric Patterns of Paper Pool
Students use concrete and pictorial representation of geometric patterns to extend patterns. In this geometric patterns lesson plan, students identify patterns and extend them.
Curated OER
Graphing Linear Equations with Two Variables
Can your class solve linear equations in two variables? They will be able to after they engage in this lesson. Individuals graph linear equations in two variables using slope and intercept and identifying the relationship between the x...
Curated OER
Calculus
Students make an inquiry with the aid of technology into the concept of functions. The emphasis of the lesson is on the interplay between the geometric and analytic information.
Curated OER
Classifying Functions
Eleventh graders sort different types of functions including rational, periodic, exponential, polynomial, quadratic, logarithmic and linear using "function cards." The functions are displayed in multiple representations including...
Curated OER
Bubble Gum Chemistry
Students explore the concept of graphing data. In this graphing data lesson, students determine the percentage of sugar in bubble gum. Students graph type of gum vs. sugar percentage. Students create a table of their data.
Curated OER
The Fourth Quadrant of Proportiona
Students experiment with scale to solve a problem presented in a video clip. They determine the correct size to use when constructing a model and evaluate the use of proportions in real life applications.
Curated OER
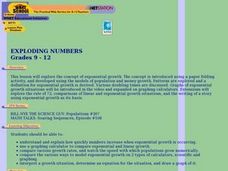
Exploding Numbers
High schoolers discuss how numbers increase when exponential growth is occurring. They view a video and compare exponential and linear growth with a graphing calculator.
Curated OER
Missed The Boat
Learners complete time and distance problems. Using appropriate problem solving strategies, students determine when a helicopter will catch a cruise ship. Learners write a summary of their solution process. They complete a graph to...
Curated OER
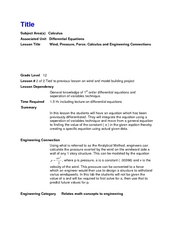
Wind, Pressure, Force, Calculus and Engineering Connections
Twelfth graders solve first order differential equations using the separation of variables technique. In this calculus lesson, 12th graders explain the connection between math and engineering. They brainstorm what engineers do in real life.
Curated OER
Reading Graphs
Students practice plotting functions on the Cartesian coordinate plane, see several categories of functions, including lines and parabolas, and read a graph, answering questions about the situation described by the graph
Curated OER
Reading Graphs
Students plot functions on the Cartesian coordinate plane. They explore lines and parabolas. Students analyze graphs and answer questions about the information presented on the graph using an online program.
Curated OER
From Playing with Electronics to Data Analysis
Young scholars collect and Analyze data. In this statistics lesson, students identify the line of best fit of the graph. They classify lines as having positive, negative and no correlation.


