Texas Instruments
TI-Nspire™ CAS
When it comes to rating educational calculators, this calculator is always near the top of this list. Now it's available as an app. There is a lot of calculator power wrapped up in this app. Not only is this a fully functioning...
Curated OER
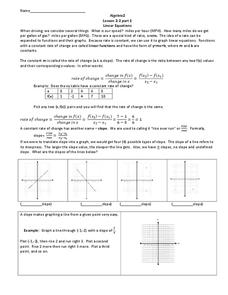
Linear Equations
Pre-algebra pupils examine the rate of change and how we can interpret it as a linear function. They are introduced to slope-intercept equations and graphs. Plenty of instruction is provided along with example problems. Note that even...
Curated OER
Inequalities 7.3
Graph inequalities and discuss the difference in their slopes. Learners observe rate of change as they compare linear, quadratic, and cubic functions.
California Education Partners
Miguel's Milkshakes
Moooove over, there's a better deal over there! The fourth segment in a series of eight requires individuals to determine the best unit cost for milk. Scholars calculate the least amount they can spend on a particular quantity of milk....
Curated OER
Understanding the Effects of Currency Exchange Rates
In this algebra worksheet, students match the currency with the country of origin. They convert between that currency and the US using a foreign exchange conversion table. There are 35 questions.
EngageNY
Comparing Linear Functions and Graphs
How can you compare linear functions? The seventh installment of a 12-part module teaches learners how to compare linear functions whose representations are given in different ways. They use real-world functions and interpret features in...
Curated OER
Writing Equations from a Table
Students use coordinates in a table to write equations. In this algebra lesson, students discuss rate of change as it relates to slope and x and y values. They plot the points from a table to graph their lines and write an equation for...
Curated OER
The Right Angle
In this algebra worksheet, students rewrite word problems using an algebraic equation to find the answer. There are 14 questions with an answer key.
Curated OER
Juggling Slopes
Students identify the slope of a line. In this algebra lesson, students label slopes as positive, negative, zero or undefined. They use the slope formula to find the slope algebraically and graphically.
Curated OER
Worksheet 20 Fall 1995
In this math learning exercise, students describe a step by step method to solve rate problems. Then they state the time derivatives of different quantities.
Curated OER
Introduction to Tangent Lines using the TI-Nspire
Learners make mathematical argument using the concept of Limit. In this algebra lesson, student calculate the instantaneous rate of change from the linear graph. They use a TI-calculator to create a visual of the graphs.
Curated OER
Mathematics Within: Algebraic Patterns
Students investigate the concept of using proportions to compare quantities while also practicing calculations for foreign exchange rates. They develop the skill of solving for unknown quantities of money while using an algebraic equation.
Curated OER
Turvey of Related Rates
In this algebra activity, students practice using related rates while solving word puzzles. They rewrite words using the correct math to do so. There is an answer key with this assignment.
Curated OER
Percent of Change
In this algebra worksheet, students convert between percents and decimals. They calculate sales tax, discounts and relative errors. There are 4 questions with an answer key.
Curated OER
Changing Units of Measure
In this algebra worksheet, students convert between units. They write expressions and simplify them. There are 4 problems with an answer key.
Curated OER
More Graphing Situations by Making a Table
Students calculate rate of change and graph linear functions. In this algebra lesson students write linear functions, make a table of points and graph their data on a coordinate plane. They calculate the rate of change of a graph.
Curated OER
Linear Graph
Students solve linear equations and graph the different functions. In this algebra activity, students graph piecewise functions using the slope and y-intercept and the given restrictions on the domain of the line. They discuss rate of...
Curated OER
Plotting Data Tables
Students make a table and plot their data on a graph. In this algebra instructional activity, students graph piecewise functions using the given equations along with the restricted domain. They calculate the rate of change.
Curated OER
More graphing situations by making a table
Students make a table and graph plotting points. In this algebra lesson, students graph linear equations on a coordinate plane. They calculate the rate of change and analyze the graph for extrapolation.
Curated OER
Between The Extremes
Students analyze graphs for specific properties. In this algebra lesson, students solve equations and graph using the TI calculator. They find the different changes that occur in each graph,including maximum and minimum.
Curated OER
Lines, Lines, Everywhere
Students explore linear equation suing real life scenarios. In this algebra instructional activity, students find the slope and intercept of a line. They create table of values to plot their graph and draw conclusions.
Curated OER
Highs and Lows
Solve problems using integration and derivatives. By using calculus, learners will analyze graphs to find the extrema and change in behavior. They then will identify the end behavior using the derivatives. Activities and handouts are...
Curated OER
Graph Your Motion
Pupils graph their linear equations. In this algebra lesson, students examine their lines and relate it to the slope or rate of change. They relate the steepness of the line to the slope being positive, negative or zero.
Federal Reserve Bank
Income Taxes
Most adults dread April 15 — tax day! Tax preparation can be intimidating even for adults. Build confidence by leading individuals through the process and then give them a scenario to practice. The exercise uses tax vocabulary to give...


