Curated OER
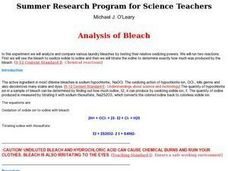
Analysis of Bleach
Students analyze and compare laundry bleaches by testing their oxidizing powers. They conduct their lab experiment, compare/contrast their results with other students' work, and complete a worksheet.
Inside Mathematics
Swimming Pool
Swimming is more fun with quantities. The short assessment task encompasses finding the volume of a trapezoidal prism using an understanding of quantities. Individuals make a connection to the rate of which the pool is filled with a...
Inside Mathematics
Vencent's Graphs
I like algebra, but graphing is where I draw the line! Worksheet includes three multiple-part questions on interpreting and drawing line graphs. It focuses on the abstract where neither axis has numbers written in, though both are...
Inside Mathematics
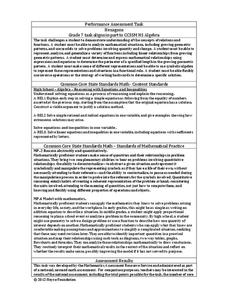
Hexagons
Scholars find a pattern from a geometric sequence and write the formula for extending it. The worksheet includes a table to complete plus four analysis questions. It concludes with instructional implications for the teacher.
EngageNY
Modeling with Exponential Functions
These aren't models made of clay. Young mathematicians model given population data using exponential functions. They consider different models and choose the best one.
Wordpress
Introduction to Exponential Functions
This lesson begins with a review of linear functions and segues nicely over its fifteen examples and problems into a deep study of exponential functions. Linear and exponential growth are compared in an investment task. Data tables are...
EngageNY
Graphs of Quadratic Functions
How high is too high for a belly flop? Learners analyze data to model the world record belly flop using a quadratic equation. They create a graph and analyze the key features and apply them to the context of the video.
Achieve
BMI Calculations
Obesity is a worldwide concern. Using survey results, learners compare local BMI statistics to celebrity BMI statistics. Scholars create box plots of the data, make observations about the shape and spread of the data, and examine the...
American Statistical Association
What Fits?
The bounce of a golf ball changes the result in golf, mini golf—and a great math activity. Scholars graph the height of golf ball bounces before finding a line of best fit. They analyze their own data and the results of others to better...
American Statistical Association
You and Michael
Investigate the relationship between height and arm span. Young statisticians measure the heights and arm spans of each class member and create a scatter plot using the data. They draw a line of best fit and use its slope to explain the...
Curated OER
Unexpected Answers
High schoolers explore the concept of fairness. In this fairness lesson, students play four probability games. High schoolers determine who has the best chance of winning each of the four games. Students discuss which games gave an...
Curated OER
Operation Spaghetti
Find the math in recipes. Young chefs will follow a recipe and investigate the total cost for materials. They measure amounts of food necessary for the recipe and compute the per person cost.
EngageNY
Interpreting the Graph of a Function
Groups sort through NASA data provided in a graphic to create a graph using uniform units and intervals. Individuals then make connections to the increasing, decreasing, and constant intervals of the graph and relate these connections...
Balanced Assessment
Movie Survey
Movie preferences will get your classes talking! Individuals read a pie graph and construct a bar graph using the same information. They then answer questions specific to the data and sample size.
Curated OER
Exploring Wyoming Species Habitats
Middle schoolers are introduced to the concept of species habitats and ranges. They introduced to ArcView GIS as a tool for mapping. Pupils use query data for species withina county, elevation, range, rivers and streams, land cover, and...
Curated OER
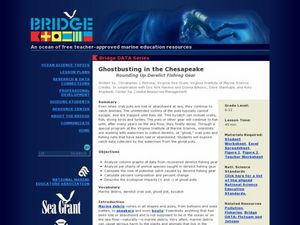
Ghostbusting in the Chesapeake
Ghost pots, fishing gear lost during crabbing expeditions, continue to trap crabs that are never collected. Increase your budding ecologists' awareness of human impact on the environment as well as conservation efforts using this...
Google
Surveys and Estimating Large Quantities
Looking for an estimation activity a bit more involved than the typical "guess the number of jellybeans in the jar" game? Here, learners use a picture to estimate the number of people at a large event, look for potential problems with...
West Contra Costa Unified School District
Writing Exponential Functions Based on Data
Give your class a concrete example of exponential growth and decay using this hands-on activity. These Algebra II lessons allow for the exploration of exponential growth and decay models, as well as the discovery of the patterns of each....
Virginia Department of Education
Aspirin Analysis
Laughter may be the best medicine, but aspirin is also important. Young chemists analyze aspirin tablets using titration in this lab experiment. They then repeat the entire experiment using a different aspirin brand.
NASA
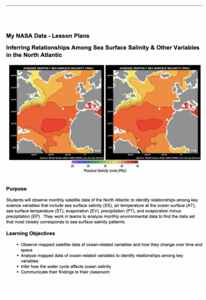
Inferring Relationships Among Sea Surface Salinity & Other Variables in the North Atlantic
Some say a picture is worth a thousand words—even from a hundred miles away! Learners review satellite data to analyze ocean variables such as temperature, salinity, evaporation, and precipitation. They look for patterns in the data and...
Curated OER
Catches and landed value of fish
Students analyze data. In this secondary mathematics lesson plan, students read and retrieve data from a statistical table on the Canadian fishing industry. Students interpret and describe data in mathematical terms and make inferences...
Curated OER
Scientific Measurement and Conversion
In this measurement worksheet, students review the rules of dimensional analysis and then determine if the 3 equations given follow the dimensional analysis rules.
Curated OER
The Boston Tea Party: Massachusetts Gazette
In this primary source analysis worksheet, students respond read an article from the 1773 Massachusetts Gazette regarding the Boston Tea Party. Students discuss the excerpt and its significance in American history.
Curated OER
My Peanut Butter is Better Than Yours!
Students explore the concept of statistical data. For this statistical data lesson, students read an article about the dangers of peanut butter to those who are allergic. Students perform a taste test of two different brands of peanut...


