Illustrative Mathematics
Proportional Relationships, Lines, and Linear Equations
The resource is a good introduction to what makes a proportional relationship between two lines. Discuss the similarities of both lines and the possibility of intersection. Use this opportunity to list other acceptable forms of each...
Common Core Sheets
Finding Amounts with Proportional Relationship
Challenging worksheets to drill your mathematicians as they crunch numbers to find the proportional relationship using fractions.
Texas Instruments
Is It or Isn't It Proportional
How can you tell if number relationships are proportional? Mathematicians investigate proportional relationships. They compare and contrast functions and graphs to determine the characteristics of proportional relationships, as well as...
Neufeld Learning Systems
Concept: Ratios and Proportions
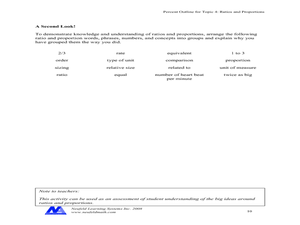
Upper elementary and middle school pupils fill out a chart creating six equivalent fractions and then compare them to six different objects and/or shapes. They group together 16 various terms related to ratios and proportions. Pupils...
Illustrative Mathematics
Walk-a-thon 1
Your mathematician's job is to explore the relationship between hours and miles walked during a walk-a-thon. The activity compels your learners to experiment with different means in finding out this proportional relationship. The answer...
Illustrative Mathematics
Find the Change
This exercise is an opportunity for algebra learners to understand the connection between the slope of a line and points found on the line. Use similar triangles to explain why slope m is the same between any two points. Discuss with the...
Illustrative Mathematics
Comparing Speeds in Graphs and Equations
Compare two different proportional relationships on a graph. It is up to your mathematicians to determine which of two moving objects have greater speed. A good example of a Common Core multiple choice question.
EngageNY
Sampling Variability in the Sample Proportion (part 1)
Increase your sample and increase your accuracy! Scholars complete an activity that compares sample size to variability in results. Learners realize that the greater the sample size, the smaller the range in the distribution of sample...
Illustrative Mathematics
Who Has the Best Job?
Making money is important to teenagers. It is up to your apprentices to determine how much two wage earners make with their after school jobs. Participants work with a table, an equation, and a graph and compare the two workers to see...
Illustrative Mathematics
Coffee by the Pound
This is a great exercise in graphing proportional quantities to interpret the unit rate as the slope of a graph. It is not easy for learners to understand what a unit rate is. When it is presented as the slope of a linear line graph,...
Illustrative Mathematics
Ratio of Boys to Girls
How many boys are in the class? Here is an introductory exercise describing ratios. The commentary shows different ways learners can approach the problem, using a tape diagram of boys to girls and using a table. The activity includes...
Curated OER
Ratio and Proportion: Basic Operations and Applications
Learners explore example problems dealing with ratios and proportions. Afterward, they read story problems and solve them using ratios and proportions. This four-page worksheet contains six multi-step problems.
Curated OER
Proportions
In this proportions instructional activity, students solve and complete 7 various types of problems. First, they determine the better buy based on the information provided for each word problem. Then, students find the value of a...
Illustrative Mathematics
Art Class, Assessment Variation
Play with paint and decide the ratio to make different shades of green. When mixing paint colors, your painters should decide which ratios make the same shade and what is needed to mix other ratios for a different shade of green. This is...
EngageNY
Families of Parallel Lines and the Circumference of the Earth
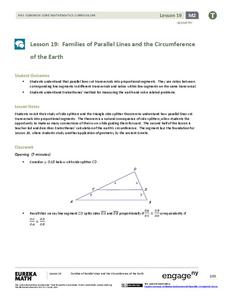
How do you fit a tape measure around the Earth? No need if you know a little geometry! Pupils begin by extending their understanding of the Side Splitter Theorem to a transversal cut by parallel lines. Once they identify the proportional...
EngageNY
Linear Functions and Proportionality
Connect linear equations, proportionality, and constant rates of change to linear functions. Young mathematicians learn how linear equations of the form y = mx + b can represent linear functions. They then explore examples of linear...
Illustrative Mathematics
DVD Profits, Variation 1
The idea in the resource is to understand the connections between proportional relationships, lines, and linear equations. To stay within the context of the standard, skip the part of the resource that solves with unit rates. Instead,...
Illustrative Mathematics
Peaches and Plums
According to the resource graph, which costs more: peaches or plums? Algebra learners compare two proportional relationships and then throw in a banana. Leaving out the scale helps students become intuitive about graphing.
EngageNY
Margin of Error When Estimating a Population Proportion (part 2)
Error does not mean something went wrong! Learners complete a problem from beginning to end using concepts developed throughout the last five lessons. They begin with a set of data, determine a population proportion, analyze their result...
PBS
Scale City — Inverse Proportions and Shadows in the Real World
Bring the resource out from the shadows. Viewers of a short video learn about drive-in theaters and how operators project images onto a large screen. They then perform an experiment to determine the relationship between the distance of...
Illustrative Mathematics
Walk-a-thon 2
During a walk-a-thon your learners must determine the walking rate of Julianna's progress. Using tables, graphs, and an equation, they must be able to calculate the time it took her to walk one mile and predict her distance based on the...
Curated OER
How Big Is That Star?
Aspiring astronomers study stars. They compare stars and explain the relationship between radius, mass, and diameter. By creating a star simulation, they discover how a binary star system's orbit can cause changes in the observed...
Illinois State Board of Education
Is It Linear?
Math apprentices are introduced to the components of a linear relationship. In groups, they write story problems that incorporate this relationship and relates to the real world. They give their problem to the class for them to solve.
Curated OER
Applying Proportionality in Scale Drawings
Sixth graders examine a blue print and discuss the reasoning behind using blue prints. In this proportionality lesson, students collaborate with their teammates to create a scale drawing. Once that is complete, 6th graders write a...


