Public Schools of North Carolina
Math Stars: A Problem-Solving Newsletter Grade 3
Make sure your class stays up with the times using this series of math newsletters. Including word problems that cover topics ranging from consumer math and symmetry to graphing and probability, these worksheets are a...
Public Schools of North Carolina
Math Stars: A Problem-Solving Newsletter Grade 2
Develop the problem solving skills of your young learners with this collection of math newsletters. Covering a variety of topics ranging from simple arithmetic and number sense to symmetry and graphing, these...
Public Schools of North Carolina
Math Stars: A Problem-Solving Newsletter Grade 1
Keep the skills of your young mathematicians up-to-date with this series of newsletter worksheets. Offering a wide array of basic arithmetic, geometry, and problem solving exercises, this resource is a great way to develop the...
Curated OER
Problem Solving: Break a Problem into Parts
Learners work with the strategy of breaking a problem into parts in order to solve it. They write an expression with parentheses for each of the first three problems, and solve the problem, and use information from a table to answer the...
Curated OER
Word Problem Practice Workbook
Need worksheets that challenge your middle schoolers to apply their understanding of math? Problem solved! From integers, fractions, and percents, to algebra, geometry, and probability, over 100 pages of word problem worksheets...
Curated OER
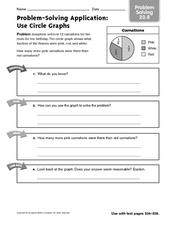
Problem Solving Application: Using Circle Graphs
In graphing worksheet, 4th graders use the information from a circle graph about carnation sales to complete the steps of problem solving. They determine what they know, and how they can use the graph. They find how many more pink...
Math Stars
Math Stars: A Problem-Solving Newsletter Grade 6
Think, question, brainstorm, and make your way through a newsletter full of puzzles and word problems. The resource includes 10 different newsletters, all with interesting problems, to give class members an out-of-the box...
Curated OER
Reading Bar Graphs
Working on bar graphs in your math class? Use a thorough worksheet to reinforce graphing and problem solving skills with your third graders. After reviewing two bar graphs, young learners answer ten questions about the data represented...
Da Vinci Design
Solving Systems of Equations
It can take a lot of time to create one worksheet. You're in luck with a set of five systems of equations worksheets! Each version has a first page solving with substitution, elimination, and graphing; followed with an assortment of...
Charleston School District
Solving Systems Graphically
When guess and check gets old, it's time to start graphing! An instructive lesson explains how to solve a system of linear equations using graphing. Equations are in both slope-intercepts and standard form.
Curated OER
Mental Math: Subtract Tens, Problem Solving
Subtracting by 10s is easy for your young learners with this worksheet! There are three questions to accompany a bar graph, and there's a space for learners to explain their answers. Encourage them to use mental math here!
Charleston School District
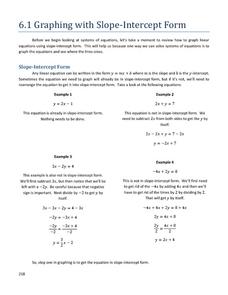
Graphing with Slope-Intercept Form
Work on graphing linear equations using the provided materials. The print and video lesson thoroughly review the concepts related to graphing linear equations in slope-intercept and standard form. The materials prepare learners for...
Curated OER
Make a Table
First and second graders participate in an experiment then create a table of tally marks to identify the totals. They problem solve, tally twenty experiences, and generate an answer to one question.
Curated OER
Leveled Problem Solving: Range and Outliers
For this range and outliers worksheet, students solve 6 word problems where they examine data then identify outliers, find the upper and lower quartile ranges, find the interquartile range and create box-and-whisker plots.
Concord Consortium
Graphing Elements
How do you graph a sentence? Scholars do just that as they represent relationships between independent and dependent variables with a graphical representation. Given a sentence, they determine the pertinent relationship and create a...
Curated OER
Use a Graph Practice 4.8
What do you like to do after school? Study this bar graph and have learners answer the five questions that follow. Consider asking learners to draw their own bar graph for number five (even though the question can be answered without...
Willow Tree
Solving Inequalities
What does solving an inequality have in common with solving an equation? Almost everything! A math resource focuses on the one exception. The examples lead learners through the steps of solving an equality when multiplying or...
Charleston School District
Graphing Functions
How do letters and numbers create a picture? Scholars learn to create input/output tables to graph functions. They graph both linear and nonlinear functions by creating tables and plotting points.
Charleston School District
Solving Systems by Inspection
Can you solve a system by just looking at it? The previous lessons in the series taught three methods of solving systems of equations. Now learners discover they can determine the number of solutions of a system just by looking at it....
Curated OER
Leveled Problem Solving: Circle Graphs
In this circle graphs worksheet, students solve 6 word problems based on a circle graph about the most popular classes for sixth graders. Students calculate angle measures of circles for 2 of the problems.
Curated OER
Problem-Solving Application: Use a Graph
In this problem solving worksheet, 6th graders use the problem solving steps of understand, plan, solve and look back to answer a graphing question.
EngageNY
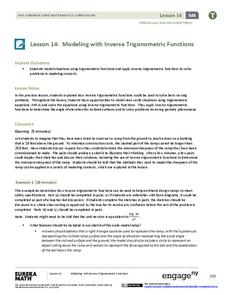
Modeling with Inverse Trigonometric Functions 2
Use inverse trigonometric functions to work with ramps, rabbits, and Talladega. The class models real-world situations with trigonometric functions and solves them using inverses in the 15th installment of a 16-part series. Pupils solve...
Curated OER
Problem-Solving Application: Use a Circle Graph
In this graphing worksheet, 4th graders use a circle graph with information about orchestra instrument to answer 5 questions. They examine the graph to find the information needed to problem solve each answer.
Curated OER
Interpreting A Line Graph - Practice Problems 15.3
In this interpreting a line graph learning exercise, learners read a graph and answer a question. Students are taken through the problem solving process by being asked to understand, plan, solve and look back at the end of the learning...


