EngageNY
Markup and Markdown Problems
There is a 100 percent chance this resource will help pupils connect percents to financial literacy. Young mathematicians use their knowledge of percents to find markups and markdowns in financial situations in the seventh segment in a...
Curated OER
Data
Students collect data from an experiment they perform. In this data instructional activity, students use multiple representations to solve practical problems; describe advantages and disadvantages of the use of each representation. Then,...
Curated OER
Tables & Data
In this subtraction activity, 4th graders problem solve 8 sentence subtraction word problems involving different types of birds. Students write their answers on the lines provided.
Curated OER
Eat Your Veggies
Students investigate displaying data. In this displaying data lesson plan, students use tallies to count data about food preferences. Students use various types of graphs such as bar graphs, picture graphs, box-and-whisker plots, etc...
Curated OER
Skate Party
Learners use the Frayer model during problem solving. For this problem solving lesson, they examine multiple methods of data collection to solve real world problems. Resources are provided.
West Contra Costa Unified School District
Point-Slope Application Problems
Create a linear equation for a problem when the intercept information is not given. The two-day lesson introduces the class to the point-slope form, which can be used for problems when the initial conditions are not provided. Pupils...
California Education Partners
Colorful Data
Scale up your lessons with a performance task. Young data analysts work through an assessment task on scaled bar graphs. They answer questions about a given scaled bar graph on favorite colors, analyze a bar graph to see if it matches...
Education Development Center
Creating a Polynomial Function to Fit a Table
Discover relationships between linear and nonlinear functions. Initially, a set of data seems linear, but upon further exploration, pupils realize the data can model an infinite number of functions. Scholars use multiple representations...
EngageNY
Tax, Commissions, Fees, and Other Real-World Percent Problems
Pupils work several real-world problems that use percents in the 11th portion of a 20-part series. The problems contain percents involved with taxes, commissions, discounts, tips, fees, and interest. Scholars use the equations formed for...
Curated OER
Data Handling: Pictogram of Birds
In this pictograph problem solving instructional activity, students analyze a pictograph of birds seen each day for a week. They use the information on the graph to solve 6 problems.
Curated OER
Find Equivalent Fractions Problem Solving 18.6
For this fractions worksheet, students analyze a data table with fractions that show screw lengths in Phillips and flat head screws. Students solve 5 word problems about equivalent fractions in the data table.
Ohio Department of Education
I Can Do This! Systems of Equations
Use tables, graphs, and substitution to solve systems of linear equations. An envelope of sample problems is passed around the classroom, and each learner has the opportunity to solve the system in the envelope. This is a great way to...
National Council of Teachers of Mathematics
Eruptions: Old Faithful Geyser
How long do we have to wait? Given several days of times between eruptions of Old Faithful, learners create a graphical representation for two days. Groups combine their data to determine an appropriate wait time between eruptions.
Statistics Education Web
Are Female Hurricanes Deadlier than Male Hurricanes?
The battle of the sexes? Scholars first examine data on hurricane-related deaths and create graphical displays. They then use the data and displays to consider whether hurricanes with female names result in more deaths than hurricanes...
Curated OER
Reading Bar Graphs
Working on bar graphs in your math class? Use a thorough worksheet to reinforce graphing and problem solving skills with your third graders. After reviewing two bar graphs, young learners answer ten questions about the data represented...
CK-12 Foundation
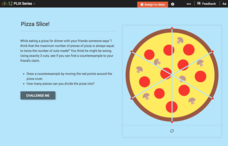
Using Quadratic Equations to Solve Problems: Pizza Slice!
Get the most out of a pizza. Class members use an interactive to simulate cutting a pizza to determine the maximum number of slices possible. The pupils create a set of data points and determine the equation that models the relationship.
Curated OER
Graphs and Data
Students investigate poverty using graphs. In this algebra instructional activity, students collect data on the effects of poverty and use different rules to analyze the data. They graph and use the trapezoid rule to interpret the data.
Curated OER
Data Analysis: For Little Learners
Using pictographs, tally charts, and surveys, kids learn all about data analysis and collection. They make surveys, collect data, then construct pictographs and tally charts to organize their information.
Curated OER
Use a Table: Problem Solving
In this math tables worksheet, learners read the math word problem and use the information from the math table with the votes for the club trip. Students then complete the problem solving method for the table for understand, plan, solve,...
Curated OER
What's Your Favorite Fruit?
A sweet activity to challenge your first graders! The picture graph displays a class's favorite fruits. Young learners solve various problems with the data, including counting the amounts of each kind of fruit, and interpreting which...
Curated OER
Multi-dimensional Modeling of Ore Bodies Making Sense of Empirical Data
Math scholars identify four different rock types in that strata and use this identification and data to construct a two dimensional geologic cross-section. They use data tables to construct a three-dimensional geologic cross-section.
Curated OER
Using Random Sampling to Draw Inferences
Emerging statisticians develop the ability to make inferences from sample data while also working on proportional relationships in general. Here, young learners examine samples for bias, and then use random samples to make inferences...
Curated OER
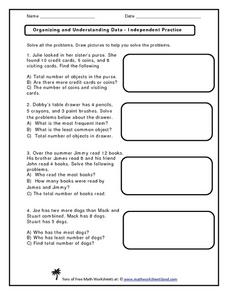
Organizing and Understanding Data - Independent Practice
Provide your first graders with an opportunity for independent practice organizing and understanding data. The ten story prompts on this three-page worksheet asks learners to solve problems involving concepts of the total number of...
Curated OER
Meatiest States: Graph Problem Solving
For this graph problem solving worksheet, students analyze a graph that shows commercial red meat production in five states. Students answer 5 word problems using the data on the graph.


