Hi, what do you want to do?
Howard Hughes Medical Institute
Gorongosa: Scientific Inquiry and Data Analysis
How does the scientific process begin? Introduce ecology scholars to scientific inquiry through an insightful, data-driven lesson. Partners examine data from an ongoing research study to determine the questions it answers. The resource...
Centre for Innovation in Mathematics Teaching
Ten Data Analysis Activities
This thirteen page data analysis worksheet contains a number of interesting problems regarding statistics. The activities cover the concepts of average measurements, standard deviation, box and whisker plots, quartiles, frequency...
Houston Area Calculus Teachers
Collecting Driving Data
Give AP Calculus classes the opportunity to check the accuracy of their calculations! A calculus activity involves the collection of data, the application of mathematics, and the analysis of the accuracy of results. Young mathematicians...
National Council of Teachers of Mathematics
Eruptions: Old Faithful Geyser
How long do we have to wait? Given several days of times between eruptions of Old Faithful, learners create a graphical representation for two days. Groups combine their data to determine an appropriate wait time between eruptions.
Federal Reserve Bank
FRED in the Classroom: Employment and the Labor Force
Acquaint your class members with data sources for employment in the United States and help them gain a better understanding of a vital measure of our economy's health.
Curated OER
Activity: An Experiment with Dice
Roll the dice with this activity and teach young mathematicians about probability. Record outcomes for rolling two number cubes in order to determine what is most likely to happen. Graph the data and investigate patterns in the results,...
Curated OER
Math Games for Skills and Concepts
A 27-page packet full of math games and activities builds on algebra, measurement, geometry, fractional, and graphing skills. Young mathematicians participate in math games collaboratively, promoting teamwork and skills practice.
Curated OER
M&M Science and Math
A series of math and science activities feature M&M's® as manipulatives to help kids work through equations. The resource includes exercises on finding averages, percent of compositions, moles in chemical reactions, genotypes and...
Heidi Songs
Zoo Animal Probability Graph
Capture the engagement of your young mathematicians with a collaborative graphing activity. Using a deck of zoo animal picture cards, students select a picture from the deck, record the chosen animal on a graph,...
US Department of Agriculture
Sink or Float?
Will it sink or will it float? Learners predict the outcome as they drop random objects into a container of water. Then, they keep track of the results and record the data in a t-chart to draw a final conclusion.
Teach Engineering
Creepy Silly Putty
It might be silly to determine the creep rate of putty but groups will enjoy making different formulations of silly putty and playing with them to understand how the different mixtures behave. The second part of the activity has groups...
Curated OER
Activity: Gummy Bear Genetics
Who's your Daddy ... and Mommy for that matter? Given a first-generation group of gummy bear offspring, young scientists must determine which bears are their parents. An activity worksheet covers the differences in genotypes and...
Wake Forest University
Authentic Activities for Connecting Mathematics to the Real World
Check out the handout from a presentation that contains a collection of high school algebra projects connecting a variety of mathematics to the real world. Activities range from simple probabilities to calculus. The activities...
Curated OER
Flipping for a Grade
What happens when your teachers get tired of grading tests and want to use games of chance to determine your grade? How would you decide which game they should play? Learn how to use expected value and standard notation to compare two...
Illustrative Mathematics
Do You Fit In This Car?
A short activity that focuses on the normal distribution as a model for data distribution. Using given means and standard deviations, your budding statisticians can use statistical tables, calculators, or other statistical software to...
Curated OER
"The Soil Around Us" Project
Learners explore how to storyboard. They examine the tasks and roles involved in creating a multimedia presentation. They create a list of quality attributes for the presentation. Use the list to improve the style, accuracy and...
National Council of Teachers of Mathematics
Nctm: Illuminations: Advanced Data Grapher
The Advanced Data Grapher can be used to analyze data with box plots, bubble graphs, scatterplots, histograms, and stem-and-leaf plots.
Other
42e Xplore: Statistics and Probability
An extensive collection of links on statistics and probability can be found here! Discussions ranging from the basics of stats through more complex data analysis. Topics are broken down into sections for teachers, students, WebQuest...
University of Cambridge
University of Cambridge: Maths and Sports: David and Goliath
Does weight give shot putters an advantage? This activity encourages students to engage in statistical analysis, and is aimed at GCSE and A-level students (Key Stages 4 and 5).
The Math League
The Math League: Ratio and Proportion
This tutorial provides definitions and examples of ratios and proportions and features comparing ratios and converting rates.
Texas Instruments
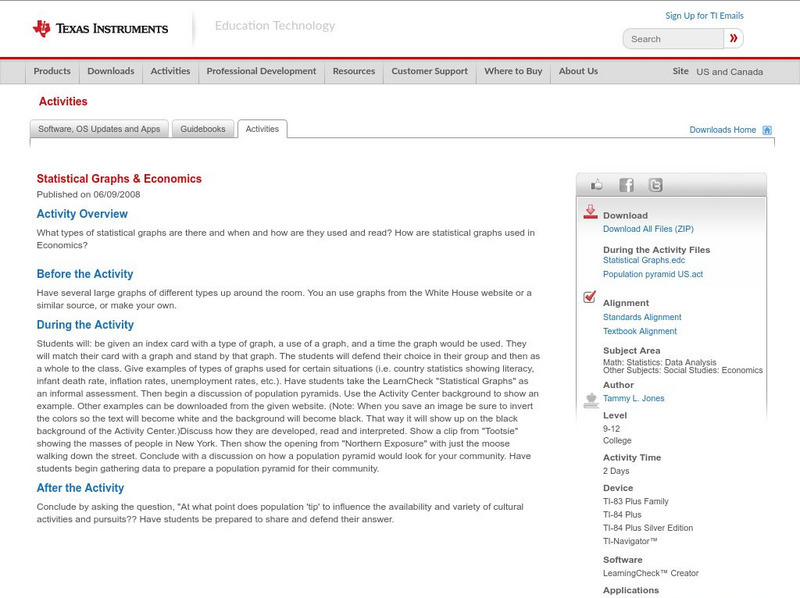
Texas Instruments: Statistical Graphs & Economics
What types of statistical graphs are there and when and how are they used and read? How are statistical graphs used in Economics?
Texas Instruments
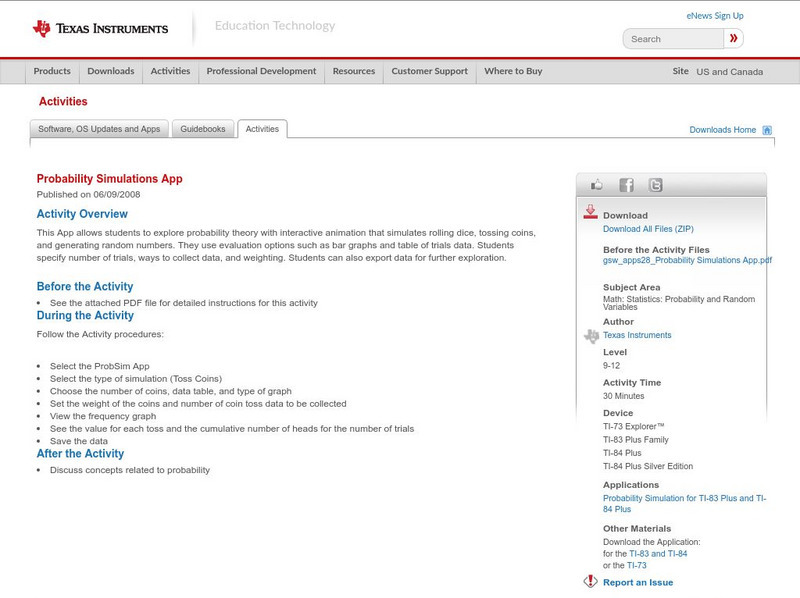
Texas Instruments: Probability Simulations App
This App allows students to explore probability theory with interactive animation that simulates rolling dice, tossing coins, and generating random numbers. They use evaluation options such as bar graphs and table of trials data....
National Council of Teachers of Mathematics
The Math Forum: Urban Systemic Initiative/oceans of Data
This site includes questions related to reading and understanding graphs. There are links on this site to lesson plans, benchmarks, and other webpages all of which mostly center about probability and statistics.
University of Baltimore
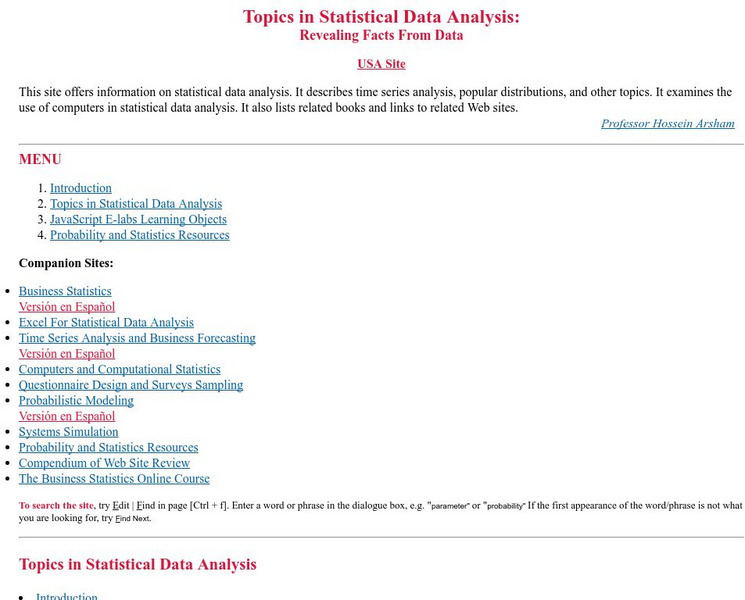
University of Baltimore: Short History of Probability & Statistics
Several brief paragraphs give a short account of the history of the study of probability and statistics. Also included are many additional resources for referencing. Written by Dr. Hossein Arsham


