Utah Education Network (UEN)
Probability and Statistics
MAD about statistics? In the seventh chapter of an eight-part seventh-grade workbook series, learners develop probability models and use statistics to draw inferences. In addition, learners play games and conduct experiments to determine...
Illustrative Mathematics
Fred's Fun Factory
Spin to win! Individuals calculate the average number of tickets expected based on a probability distribution for the number of tickets per spin. Pupils use that information to determine the average number of tickets that can be won...
Curated OER
Flipping for a Grade
What happens when your teachers get tired of grading tests and want to use games of chance to determine your grade? How would you decide which game they should play? Learn how to use expected value and standard notation to compare two...
Curated OER
Continuous Probability Distributions
In this continuous probability distribution worksheet, learners identify discrete and continuous distributions. They calculate the linear combination of the independent normal random variable and determine probabilities using exponential...
Google
The Law of Large Numbers and Probability
Learners investigate why theoretical probability doesn't always match reality. The activity involves using Python 2.7 (or Sage) to set up a Bernoulli Trial. It also involves setting up a spreadsheet to simulate the Birthday Paradox....
Illustrative Mathematics
Rolling Dice
Rolling dice is a great way for your mathematicians to get a hands-on approach to probabilities. Use the chart to record whether they rolled a six during ten attempts. Calculate results individually (or in small groups) and then record...
Curated OER
Math Applications
In this math applications worksheet, students solve one word problem that has two parts to it. First, they determine the expected value of a ticket for a prize. Then, student determine the fair price for the ticket purchased and explain...
Curated OER
Fred's Fun Factory
Round and round and round she goes. Where she stops, nobody knows. This activity uses a common arcade game of chance, the spinning wheel, as a platform for computing expected values, interpreting results, and applying this knowledge to...
Illustrative Mathematics
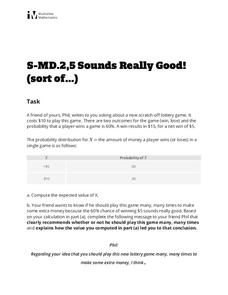
Sounds Really Good! (Sort Of...)
Winning a lottery game with 60% odds sounds like a no brainer. This is when the math kicks in to show players that in the long run, they lose money the more often they play. Here is one simple question that opens the doors to a nice...
Curated OER
Bob's Bagel Shop
How much money can Bob expect to make per customer by selling bagels? This short expected value problem can be used as a warm up or a quick assessment at the end of a more detailed lesson. Teacher commentary includes the solution to the...
Curated OER
Sounds Really Good! (sort of...)
Your friend Phil wants to know if he should play the lottery. Have your class use the given data to compute the expected value and explain to Phil what he should do and why. This handout is ideal for a quick assessment of skill and...
Curated OER
Math Applications 2
In this probability worksheet, students solve 1 word problem with three different parts to it. First, they find the probability of drawing an ace from a deck of cards. Then, students determine the probability that they will draw an ace...
Curated OER
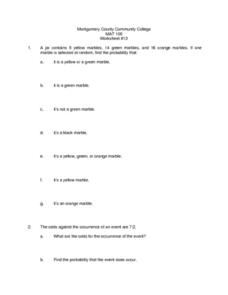
Math Applications 13
In this probability worksheet, students solve 2 different problems that include 7 parts in the first one and 2 parts in the second. First, they find the probability that one marble selected at random from a jar will be yellow or green....
Curated OER
The Apple Blossom Problem
In this apple blossom problem, students examine a given situation in a board game. They determine the best way to win the game and the expected payoff. This one-page worksheet contains 1 problem.
EngageNY
Summarizing a Data Distribution by Describing Center, Variability, and Shape
Put those numbers to work by completing a statistical study! Pupils finish the last two steps in a statistical study by summarizing data with displays and numerical summaries. Individuals use the summaries to answer the statistical...
Curated OER
Looking at Conflict
In this conflict worksheet, students answer a set of 6 questions related to conflict. Site has links to additional resources.
Khan Academy
Khan Academy: Mean (Expected Value) of a Discrete Random Variable Practice
A practice word problem asking learners to calculate the mean of B in a probability chart.


