Curated OER
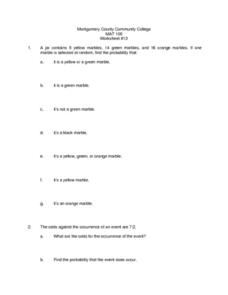
Math Applications 13
In this probability worksheet, students solve 2 different problems that include 7 parts in the first one and 2 parts in the second. First, they find the probability that one marble selected at random from a jar will be yellow or green....
Curated OER
Rolling For Value
Students participate in a lesson to comprehend the concept of probability while rolling dice. They recognize patterns while making observations and recording the data for each roll. Students also review place values while playing a game...
Curated OER
Calculating Theoretical & Experimental Probability
Students explore the concept of experimental and theoretical probability. In this experimental and theoretical probability instructional activity, students collect data by conducting a survey of their classmates. Students compare their...
Illustrative Mathematics
Accuracy of Carbon 14 Dating II
The scientific issue of carbon-14 dating and exponential decay gets a statistics-based treatment in this problem. The class starts with a basic investigation of carbon content, but then branches out to questions of accuracy and ranges of...
Rice University
Introductory Statistics
Statistically speaking, the content covers several grades. Featuring all of the statistics typically covered in a college-level Statistics course, the expansive content spans from sixth grade on up to high school. Material comes from a...
EngageNY
Making Fair Decisions
Life's not fair, but decisions can be. The 17th installment of a 21-part module teaches learners about fair decisions. They use simulations to develop strategies to make fair decisions.
Curated OER
The Apple Blossom Problem
For this apple blossom problem, learners examine a given situation in a board game. They determine the best way to win the game and the expected payoff. This one-page worksheet contains 1 problem.
101 Questions
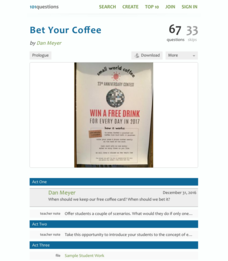
Bet Your Coffee
Coffee drinkers, rejoice, here's a chance to win free coffee! Coffee club card holders have the chance to win free coffee every day for a year—but they must enter using their cards good for a free cup. Scholars weigh the chances of...
Curated OER
Probability Distributions
Students collect and plot data on a graph. In this statistics instructional activity, students analyze the distribution of a sample and predict the outcome. They find the line of best fit and discuss what would make the sample larger.
EngageNY
Margin of Error When Estimating a Population Mean (part 1)
We know that sample data varies — it's time to quantify that variability! After calculating a sample mean, pupils calculate the margin of error. They repeat the process with a greater number of sample means and compare the results.
College Board
2004 AP® Statistics Free-Response Questions
Provide some practice showing the work. Pupils work through six free-response questions that require them to show their work. They use their knowledge of statistics to develop solutions to problems within context. Scenarios range from...
College Board
2001 AP® Statistics Free-Response Questions
Develop a complete understanding of the course. Pupils and teachers use the six free-response questions to gather information about aspects of the AP® Statistics course. The resource and test section show how items cover the content. A...
Curated OER
Seeing Is Believing
Students investigate the concepts of probability. They use data to find the central tendency, median, and mode. Students design and play a game in order to practice the concepts. They also complete a table with data that is analyzed.
Curated OER
A Lottery of Learning
Students investigate the probability necessary to win the lottery. They view a PowerPoint Presentation, evaluate combinations, calculate lottery probability, conduct analysis of a fair game, and design a lottery to meet various...
Curated OER
Math Games for Skills and Concepts
A 27-page packet full of math games and activities builds on algebra, measurement, geometry, fractional, and graphing skills. Young mathematicians participate in math games collaboratively, promoting teamwork and skills practice.
Curated OER
Mean, Variance, and Standard Deviation for the Binomial Distribution
Students review previous lessons on mean, variance, standard deviation, and expected value. They utlize formulas for these characteristics that are specifically designed for the binomial distribution. Students discuss the similarities...
EngageNY
Fair Games
What constitutes a fair game? Scholars learn about fair games and analyze some to see if they are fair. They extend this idea to warranties and other contexts.
Curated OER
The Why and How of General Terms
Sixth graders find the recurrence relation for simple sequences
construct tables of values for a pattern. They find the value of the general term of a sequence algebraically.
Curated OER
How Wealthy Are Europeans?
Students investigate measures of central tendency. They examine compiled data and conduct critical analysis. The graph is focusing on the gross domestic product data. The lesson also reviews the concept of putting values in order of...
College Board
Power in Tests of Significance
Test your knowledge of tests of significance. A curriculum model for AP® Statistics describes and defines power in terms of tests of significance. It also provides two classroom activities designed to investigate power and how it relates...
Radford University
A Change in the Weather
Explore the power of mathematics through this two-week statistics unit. Pupils learn about several climate-related issues and complete surveys that communicate their perceptions. They graph both univariate and bivariate data and use...
EngageNY
Summarizing a Data Distribution by Describing Center, Variability, and Shape
Put those numbers to work by completing a statistical study! Pupils finish the last two steps in a statistical study by summarizing data with displays and numerical summaries. Individuals use the summaries to answer the statistical...
Curated OER
Who Does the Lottery Benefit?
Students investigate the pros and cons of the lottery. In this algebra activity, students use the formulas for permutation and combination to test their arguments about the lottery. They collect data about their argument and plot it on a...
Curated OER
Properties of Logarithms
Students explore the concept of logarithms. In this logarithms instructional activity, students graph logarithms on their Ti-Nspire calculator. Students describe the shapes of their graphs by identifying slope, y-intercepts, and...


