Curated OER
Analyze and Interpret Statistical Information
For this probability and statistics worksheet, 9th graders analyze and interpret histograms as they identify trends in the data. The two page worksheet contains four problems. Answers are provided.
Project Maths
Outcomes of Coin Tosses
Flip a coin: heads, use the resource; tails, use the resource. The fourth of six installments of the Statistics & Probability unit looks at coin tosses and probability. The class conducts an experiment and sees that the outcomes of...
Shodor Education Foundation
Racing Game with One Die
Pupils roll a die to figure out which car advances on a race track. They determine the rules for each car moving forward and, given the statistics of the winner, compare if it matches their predictions.
Curated OER
Starting With Stats
Statisticians analyze a data set of student IQs by finding measures of central tendency and dispersion such as mean, median, mode, and quartiles. They practice using a graphing calculator to find the values and analyze box plots and...
Curated OER
Mathematics: A Picture's Worth a Thousand Words
Students examine school yearbooks from 1950 to the present. They count the number of male and female teachers and administrators. They compile date and extrapolate changes in job trends.
Illustrative Mathematics
Accuracy of Carbon 14 Dating II
The scientific issue of carbon-14 dating and exponential decay gets a statistics-based treatment in this problem. The class starts with a basic investigation of carbon content, but then branches out to questions of accuracy and ranges of...
Radford University
Corn and Popcorn
Have a popping good time. Using probability and statistics skills, learners determine which type of popcorn to buy based on the percentage of kernels popped. After analyzing corn and popcorn sales to make a prediction of future sales,...
US Department of Commerce
The New Normal
Don't be normal ... be exceptional in understanding statistics. Pupils analyze six different sets of census data using histograms or normal probability plots to determine whether each data set fits a normal distribution. They then get...
Curated OER
Boxing Up
Middle schoolers explore the relationship between theoretical and experimental probabilities. They use a box model to enter data provided and to randomly draw tickets from the box. Pupils click on any bar in a chart to display the...
Curated OER
Quiz: Mutually Exclusive Events, Independent Events, and Complement of an Event
In this statistics learning exercise, students tell the relationship of two events. Students find the complement of given events. They compute the probability of a given event occurring.
Curated OER
Musher Graphing and Probability
Students use the internet to research statistical information on the musher dogs participating in the Iditarod. Using the data, they create three different types of pie charts. They use the charts to answer questions about the dogs. They...
Curated OER
Energy Content of Foods
Learners collect data, organize and analyze the data and compare it to real life scenarios. This assignment requires two class periods.
Curated OER
Eye on the Prize challenge
In this spinner math worksheet, students draw arrows on spinners to show numbers needed to add totals and solve number combinations to total ten. Students solve four problems.
Curated OER
The Gear Problem
In this math worksheet, students apply their knowledge of angles and rotation to solve a word problem involving an old pocket watch. They discuss gears, rotation and accuracy.
Curated OER
Integrated Algebra Practice: Probability of Independent Events #1
For this statistics and probability worksheet, students identify 10 events as independent or dependent. Eight of these are short answer problems. Two problems are multiple choice, presenting the students with four events. Students...
Virginia Department of Education
What Are the Chances?
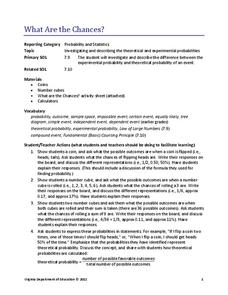
Take a chance on an informative resource. Scholars conduct probability experiments involving coins and number cubes to generate data. Compiling class data helps connect experimental probability to theoretical probability.
Education Development Center
Creating Data Sets from Statistical Measures
Explore the measures of central tendency through a challenging task. Given values for the mean, median, mode, and range, collaborative groups create a set of data that would produce those values. They then critique other answers and...
Education Development Center
Interpreting Statistical Measures—Class Scores
Explore the effect of outliers through an analysis of mean, median, and standard deviation. Your classes examine and compare these measures for two groups. They must make sense of a group that has a higher mean but lower median compared...
Curated OER
Algebra/Geometry Institute 2007
Fifth graders practice calculating probability using statistics. In this math statistics activity, 5th graders discover the meanings of the terms unlikely, likely, eventually, and chance, when asked to answer questions about the...
Curated OER
Corrupted Politicians
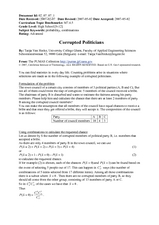
Students solve problems using statistics and probability. In this math lesson, students analyze how many corrupted members there are in a fictional town council. They give real life examples where statistics and probability can be used.
Curated OER
Why NP Min?
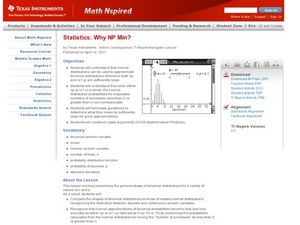
Students calculate the normal distribution. For this statistics lesson, students use the normal distribution to estimate binomial distributions. They define when to use NP and n(1-p) to make approximations.
Curated OER
Remote Possibilities
Pupils collect data and analyze the data using a graph. In this statistics lesson, students use combinations and theoretical and experimental probability to analyze their data. They observe a remote controlled robot as they collect data.
Curated OER
Misleading Graphs
Students explore number relationships by participating in a data collection activity. In this statistics instructional activity, students participate in a role-play activitiy in which they own a scrap material storefront that must...
Curated OER
Assessing Normalcy
Students define normal distribution as it relates to the bell curve. In this statistics lesson, students use the central tendencies of mean, median and mode to solve problems. They plot their data and draw conclusion from the graphs.


