College Board
Civic Knowledge and Action: Voter Registration
What does the data say? Using provided voter data from the 2016 presidential election, scholars describe the data and identify questions they could answer by analyzing it. Learners then construct tables and use them to determine whether...
Curated OER
POWER OF VOTING
Fifth graders explain the process of a national presidential election by researching through the Internet and holding an election simulation. They collect, graph, and interpret election data. They enhance their computer skills by...
Curated OER
Voter Turnout
Explore politics by analyzing the voting process. Pupils discuss the purpose of casting votes in an election, then examine graphs based on the data from a previously held election's turnout. The lesson concludes as they answer study...
Curated OER
Did Voters Turn Out -- or Are They Turned Off?
What was the voter turnout at your last state election? Examine voter turnout statistics from the most recent election to learn which ten states have the best turnout record. This lesson offers election data, handouts, and worksheets.
Curated OER
A Presidential Election Poll
In this math worksheet, students solve 4 story problems pertaining to the Bush-Gore election of 2000. Students use all math operations to solve these problems.
Curated OER
Ch. 1 Practice Exam
In this elections activity, students match 5 methods of counting votes for candidates to their descriptions. Students match 4 different types of fair candidates with their descriptions. Students problem solve 7 election scenarios.
Curated OER
Voting Time
In this math worksheet, students solve 4 story problems pertaining to elections in the United States. Students will use all four math operations in these problems.
Curated OER
We the People: A Study in American Voter Turnout: US Government
Students examine and compare voter turnout in US Elections. They write a letter to a favorite candidate or representative suggesting ways to increase voter turnout.
Curated OER
Campaign 2000
Students research newspapers and the Internet to learn about the election. Students work in groups and choose a state that they want to compare to Florida. Students organize the data they have found into a graph labeling an "x" and "y"...
Illustrative Mathematics
Electoral College
A cross-curricular resource that takes the electoral votes and allows your learners to organize and analyze the data. Young voters can determine which states are more influential and interpret the dotplot provided for more data....
Curated OER
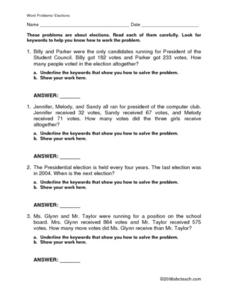
Elections Word Problems
In this math and social studies worksheet, students find the answers to word problems that are centered around the topic of political elections.
Curated OER
Voter Turnout
Students solve problems using math. They complete a graph, using data from the 2000 presidential election results. Students predict and calculate the outcome of the election based upon the voting patterns.
Curated OER
Data Analysis and Bias
In this probability and statistics worksheet, students determine when a collected data or a graph of the data could be biased. The one page worksheet contains four multiple choice questions. Answers are included.
Curated OER
Matrices
For this Algebra II worksheet, 11th graders solve problems that involve matrix representation, matrix operations, solving systems with inverse matrices, row reduction, and systems of inequalities. The six page worksheet contains twenty...
Curated OER
Pictures of Data: Post Test
For this data worksheet, students answer multiple choice questions about charts and graphs. Students answer 10 questions total.
Curated OER
Analyzing Data and Finding Bias
In this algebra worksheet, students identify bias as they analyze data. They solve word problems about sampling and surveys. There are 2 questions with an answer key.
Curated OER
Collecting Data
In this algebra instructional activity, students collect and analyze data. They graph and identify their solutions. There is one question with an answer key.


