Intel
Track the Trends
Allow your classes to research what interests them. An engaging STEM lesson, the fourth in the series of six, asks individuals to choose a topic of interest and analyze the data through regression models. The regression equations allow...
Towson University
Looking Backwards, Looking Forward
How do scientists know what Earth's climate was like millions of years ago? Young environmental scholars discover how researchers used proxy data to determine the conditions present before written record. Grouped pupils gain experience...
Code.org
Creating Summary Tables
Let the computer summarize all that data. Pairs work together to learn how to create pivot tables by following directions in the online module. They then utilize the data collected from the beginning of the unit to create their own...
EngageNY
Describing the Center of a Distribution Using the Median
Find the point that splits the data. The lesson presents to scholars the definition of the median through a teacher-led discussion. The pupils use data lists and dot plots to determine the median in sets with even and odd number of data...
Virginia Department of Education
May I Have Fries with That?
Not all pie graphs are about pies. The class conducts a survey on favorite fast food categories in a lesson plan on data representation. Pupils use the results to create a circle graph.
Willow Tree
Bar Graphs
Circles, lines, dots, boxes: graphs come in all shapes in sizes. Scholars learn how to make a bar graph using univariate data. They also analyze data using those bar graphs.
Kenan Fellows
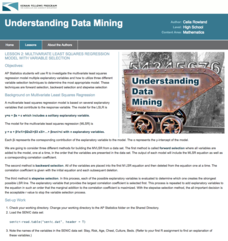
Multivariate Least Squares Regression Model with Variable Selection
The risk of contracting an infection in the hospital is low, but it does happen. Learn what risk factors have the highest correlation with hospital-acquired infections in the final lesson of a three-part series. Using the open source R...
EngageNY
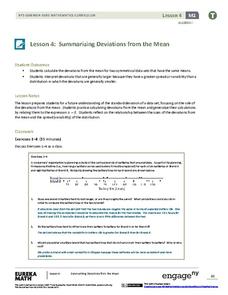
Summarizing Deviations from the Mean
Through a series of problems, learners determine the variability of a data set by looking at the deviations from the mean. Estimating means of larger data sets presented in histograms and providing a way to calculate an estimate round...
NOAA
History's Thermometers
How is sea coral like a thermometer? Part three of a six-part series from NOAA describes how oceanographers can use coral growth to estimate water temperature over time. Life science pupils manipulate data to determine the age of corals...
Concord Consortium
Gestation and Longevity
Is the gestation length of an animal a predictor of the average life expectancy of that animal? Learners analyze similar data for more than 50 different animals. They choose a data display and draw conclusions from their graphs.
University of Richmond
The Forced Migration of Enslaved People 1810-1860
Slavery not only involved the forced migration of African people from their homes, it also meant the forced removal of people within the United States. Using data and interactive graphics, scholars see how the tragedy of human slavery...
NOAA
Understanding El Niño Using Data in the Classroom
Are weather troubles caused by El Nino? An installment of a larger series presents a five-part lesson on El Nino. First, scholars learn to read sea surface temperature maps. Then, they compare them to data on graphs before determining if...
Curated OER
Dealing With Data
Students collect, organize, and display data using a bar graph, line graph, pie graph, or picture graph. They write a summary describing the data represented and compare the graph to another graph in the class.
Curated OER
The Dog Days of Data
Students practice an alternative form of data presentation. They practice sequencing data, identifying the stem-and-leaf, creating stem-and-leaf plots, and drawing inferences from the data by viewing the plots.
Curated OER
The Dog Days of Data
Students are introduced to the organization of data This lesson is designed using stem and leaf plots. After gather data, they create a visual representation of their data through the use of a stem and leaf plot. Students
drawing...
Curated OER
Organizing Data
Third graders investigate ways to organize data. For this tally marking lesson plan, 3rd graders practice drawing tally marks to represent an item of data. Students also make connections with skip counting by fives.
Curated OER
Pictures of Data: Post Test
In this data worksheet, learners answer multiple choice questions about charts and graphs. Students answer 10 questions total.
Curated OER
Pictures of Data
In this data worksheet, students look at maps and charts and answer multiple choice questions about them. Students complete 10 questions.
Curated OER
What's in a Graph?
How many yellow Skittles® come in a fun-size package? Use candy color data to construct a bar graph and a pie chart. Pupils analyze bar graphs of real-life data on the Texas and Massachusetts populations. As an assessment at the end of...
Bowland
My Music
Scholars investigate how the tempo of music affects heartbeats. Groups develop hypotheses about music and its connection to heartbeats before carrying out an experiment. They analyze and present data from their investigations.
Houghton Mifflin Harcourt
Zombie Ants
One of the creepiest and coolest natural occurrences is a great forum for data analysis and discussion! Explore the phenomenon of zombie ants, or ants infected with the Cordyceps fungus, with a series of activities and experiments. Kids...
Curated OER
Comparing Data
Eighth graders create a survey, gather data and describe the data using measures of central tendency (mean, median and mode) and spread (range, quartiles, and interquartile range). Students use these measures to interpret, compare and...
Curated OER
Fire Wars
Your class can practice collecting and analyzing data. They extrapolate information and derive data from fire season statistics. They also choose the most appropriate format to display collected data.
Curated OER
Maps and Modes, Finding a Mean Home on the Range
Fifth graders investigate data from maps to solve problems. In this data lesson, 5th graders study maps and collect data from each map. Students present their data in a variety of ways and calculate the mode, mean, median, and range.


