Cheetah Outreach
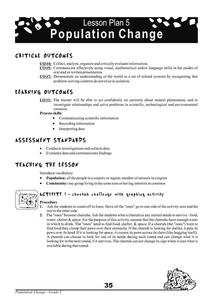
Population Change
Your youngsters become cheetahs in search of food, water, shelter, and space in a fun physical game that does a fantastic job of representing fluctuating species population based on resources available over years.
Radford University
Is it Really a Small World After All?
Working in groups, learners research four countries' populations over the past 30 years. Using the data collected, the teams find regression equations that best fit the data. Taking the regression equations, they then make predictions...
Bowland
Fashionista
So trendy! Show your class how to identify trends in sales patterns using mathematics. Scholars use a software simulation to collect data on age groups, price, and sales at a fashion store. This data allows individuals to determine the...
Radford University
Animal Decline
Where did they all go? Small groups collect data on different animal species that are on a decline. Teams develop equations to model the populations over time and then create presentations about the decline of their animals. Classmates...
Curated OER
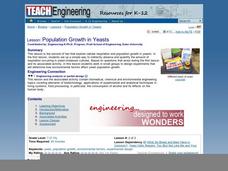
Population Growth in Yeasts
Students design an investigation using yeast. In this environmental engineering lesson, students design an investigation to determine how environmental factors affect the growth of yeast. They will collect quantitative data and discuss...
Curated OER
Where is Everybody?
Students collect data from different grade levels at their school and develop thematic maps which show population density, and determine how this might affect the school and themselves in the future.
EngageNY
Posing Statistical Questions
Is this a statistical question? The opening lesson in a series of 22 introduces the concept of statistical questions. Class members discuss different questions and determine whether they are statistical or not, then they sort the data...
Statistics Education Web
Walk the Line
How confident are you? Explore the meaning of a confidence interval using class collected data. Learners analyze data and follow the steps to determine a 95 percent confidence interval. They then interpret the meaning of the confidence...
Howard Hughes Medical Institute
Human Impacts on Biodiversity
Have you always wanted to take your science class on an amazing field trip they will never forget? Now you can! Observe the wildlife in an African savanna through trail cameras with a five-part data analysis activity. Learners analyze...
Curated OER
Population Growth
High schoolers grow duckweed, observe what happens when an organism population is allowed to grow without predation or competition, view videos about invasive species, and develop a proposal for controlling the growth of an invasive...
Curated OER
African American Population Shifts
Students investigate population trends. In this African American history lesson, students access U.S. Census records from 1900 to the present online. Students analyze the migration of African Americans from one area of the U.S. to another.
Curated OER
The Correlation Between Human Population Growth and Dwindling Natural Resources
Eighth graders predict human population growth. In this lesson, 8th graders discuss the length of time needed to double the human population, work in groups to chart population growth and predict population growth in the...
American Statistical Association
Don't Spill the Beans!
Become a bean counter. Pupils use a fun activity to design and execute an experiment to determine whether they can grab more beans with their dominant hand or non-dominant hand. They use the class data to create scatter plots and then...
EngageNY
Types of Statistical Studies
All data is not created equal. Scholars examine the different types of studies and learn about the importance of randomization. They explore the meaning of causation and when it can be applied to data.
Curated OER
Create a Graph Online
Scholars create colorful bar, line, or pie graphs. They decide on a survey question to ask or a type of data to gather. From there, they collect information and data. They display this data in bar, line, or pie graphs that they create...
Curated OER
Are There Too Many Elk?
Students use information about elk populations in Arizona to make recommendations about population management. In this ecology instructional activity, students discover the problems associated with having a heard of elk that is too...
Curated OER
Surveys and Samples
In this surveys and samples activity, students discover data collection techniques and write their own survey questions. Students use random sampling, convenience sampling, and systemic sampling and analyze their results.
Curated OER
Population Growth
Students examine the factors that affect population growth such as, the length of life cycles, carrying capacity and competition. In this population lesson students conduct an experiment on population growth and collect data and analysis.
Curated OER
Elbow Room - Exploring Population Density
In this population worksheet, students click on the links and research the internet about population, land, and government. Students answer 16 short answer questions including making spreadsheets.
Curated OER
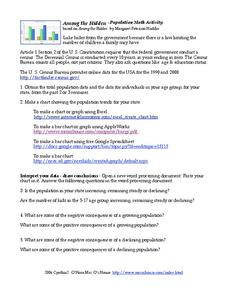
Among the Hidden - Population Math Activity
In this population worksheet, students collect data on population by researching the Census Bureau and then make online graphs and answer short answer questions about the data. Students complete 5 problems total.
Statistics Education Web
Using Dice to Introduce Sampling Distributions
Investigate the meaning of a sample proportion using this hands-on activity. Scholars collect data and realize that the larger the sample size the more closely the data resembles a normal distribution. They compare the sample proportion...
Radford University
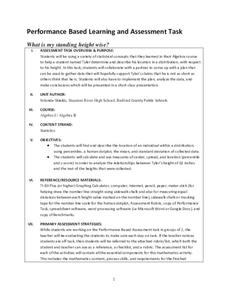
What is My Standing Height Wise?
Given a scenario in which a class member wants to prove his height is not an outlier, pairs devise a plan and gather evidence to help support his claim. The small groups implement their plans and create graphical displays of their data...
Curated OER
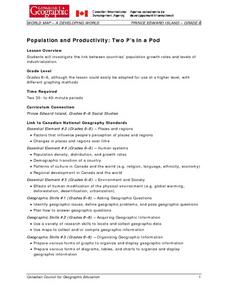
Population and Productivity: Two P's in a Pod
Students investigate the link between countries' population growth rates and levels of industrialization. They observe that, over time, as a country becomes more industrialized, its population growth rate decreases.
Curated OER
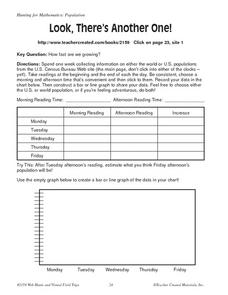
Look, There's Another One!
In this math worksheet, young scholars spend a week collecting information on either the word or U.S. populations from the U.S. Census Bureau Web site. Students record their data in a chart and bar graph. Young scholars also use the...


