Curated OER
Reshaping the Nation
Young scholars learn why the census makes a difference. In this U.S. Census lesson plan, students learn how to read and use a cartogram while they explore new ways to represent data.
Curated OER
Selection and Variation in the Egyptian Origami Bird
Students investigate genetics and evolution of species. They simulate the breeding of birds using origami birds. In addition, using dice they introduce genetic variation into the species.
Curated OER
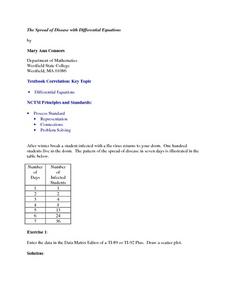
The Spread of Disease with Differential Equations
Twelfth graders solve problems using differential equations. In this Calculus lesson, 12th graders analyze data regarding the spread of a flu virus. Students use the symbolic capacity of the TI-89 to develop a model and analyze the...
Curated OER
Site and Situation: Right Place at the Right Time
Students put their geography skills to work. In this geography skills instructional activity, students research maps and other primary and secondary sources to simulate the site selection process for the Pennsylvania Railroad Shops post...
Curated OER
Coral Reefs
Young scholars research coral reefs and identify their benefits to humans, threats to the reef, how to reduce and eliminate threats, and more. In this coral reef lesson plan, students research the reefs, and take a field trip to an...
Curated OER
Endangered Species
Students create a postcard about endangered species. In this biology lesson, students identify how human activities endanger other species. They research and recommend ways to help protect them.
Curated OER
Omaha Race Riot of 1919
Students analyze primary documents and images. Students organize and evaluate the causes and results of the Omaha race riot of 1919. Students study and recognize key personalities involved. Students relate history to certain quotes...
Curated OER
The Interdependence of Birds and the Great Salt Lake Ecosystem
Tenth graders participate in the "Checks and Balances" game. This game lets them experience the interdependence of oragnisms specific to the Great Salt Lake. They recieved informaton about food chains, food webs, trophic levels various...
Curated OER
Introduction to Mathematical Modeling
In this mathematical modeling activity, students answer two essay questions. They describe Newton's Law of Cooling by describing and constructing a model and answering seven essay questions about the process.
Curated OER
Marine Life Protected Areas in the O.C.
Students research a Marine Protected Area and determine the species' that benefit from its protection. In this marine lesson students present their findings to the class using PowerPoint.
Curated OER
Clipbirds
Students attempt to pick up various objects with a wide variety of beaks, including scissors, spoons, etc.
Curated OER
Paying for Crime
Students participate in activties examining ratios and proportions. They use graphs to interpret data showing the government's budget for prisons. They present what they have learned to the class.
Curated OER
Something Fishy (Statistics)
Students are introduced to a problem involving an environmental issue. They are introduced to the capture-recapture method which involves capturing fish, tagging them, returning them and recapturing another sample. Pupils work in...
Curated OER
Examine Your State Government's Demographics
How is your state government organized? How many elected officials are women? What is the mean age of your state representatives? Young scholars answer these questions in a research project before creating a chart to reflect their...
Curated OER
Biggest Cities in Each State Quiz
In this online interactive geography quiz worksheet, students examine the chart that includes the names of 50 U.S. states. Students identify the names of the two largest cities in each state in 8 minutes.
Curated OER
The Rise and Fall of the Mammoths
Students develop an understanding of the evolution of species in the context of the woolly mammoth. They examine the fossil record to explain natural selection.
Michigan Sea Grant
Food Chains and Webs
Starting with a simple food chain, young scientists interpret the difference and interrelatedness between herbivores, carnivores and producers. They answer questions related to cause and effect of food chain disruptions, including the...
Curated OER
America's Rain Forests Can It Be Real?
Students examine the attributes of unusual plants and animals before determining how they are adapted to specific habitat. They complete an associated worksheet. They make posters with information that they find during research sessions.
Curated OER
Extinction Extravagance
Students brainstorm and discuss what it means for a species to be considered endangered and/or extinct. They research animals in Puerto Rico and choose one that is considered endangered and create a poster about it. In addition, they...
Curated OER
The World of Neonatal Nursing
Students explore the world of neonatal nursing. They research all the qualifications to becoming a neonatal nurse. Students unveil what neonatal nursings affect on the environment is.
Curated OER
Then and Now
Students conduct research and use census data to compare different times and places. In this census lesson, students interpret data from charts and graphs, comparing census information from two time periods as well as from two different...
Curated OER
Students Analyze Data With Scatter Plots
Scatter plot lessons can help students create different types of graphs by hand or with the aid of technology.
Curated OER
The Game of Life
Students describe what it means for a marine animal or fish to be threatened or endangered after playing game simulating extinction.
Other popular searches
- Ecology Population Changes
- Graphing Population Change
- Changes Population Size
- Monitoring Population Change
- Geography Population Change
- Arawak Population Changes
- Uk Population Change


