Curated OER
Coordinate Geometry
Grab your class and get them graphing polygons on a coordinate plane! They investigate the four quadrants, discover the x and y axis, and correctly plot ordered pairs. To show their comprehension, each child creates a coordinate picture...
Curated OER
Impossible Graphs
Young scholars practice plotting functions on the Cartesian coordinate plane while participating in a discussion about the Possible Or Not worksheet/activity. Students also use the Impossible Graphs worksheet to practice reading a graph,...
Curated OER
What's Brewing? Graphing On A Coordinate Plane
For this graphing worksheet, young scholars graph given ordered pairs on a coordinate plane and connect the dots in consecutive order. Upon completion of the graphing exercise, students will have created a picture on the coordinate...
Curated OER
Hyperbolas
Students engage in a lesson that covers the concepts related to the graphing of hyperbolas looking at topics like foci, center, vertices, and asymptotes. They find multiple different points in the coordinate plain and then plot the graph.
Curated OER
Graph It
Elementary and middle schoolers engage in a lesson of graphing in quadrant I of the coordinate plain. They use the graph to create shapes and symbols. While using a graphing calculator, they locate the points on the coordinate plane. In...
Curated OER
Lines, Lines, Everywhere
Pupils explore linear equation suing real life scenarios. In this algebra lesson, students find the slope and intercept of a line. They create table of values to plot their graph and draw conclusions.
Curated OER
Plotting Plates
Students investigate plate tectonics and their correlation with natural phenomena like earthquakes and volcanoes. They use the internet to see real-time data about earthquakes and volcanoes. Students plot latitude and longitude points on...
Curated OER
Plotting a Magnetic Field
High schoolers experiment with a set of materials. They plot the magnetic field that arises from a regular bar magnet. They discover how a magnet affects a compass.
Curated OER
Plotting Amish Farmland
Second graders listen to the book, Down Buttermilk Lane by Barbara Mitchell. They discover how to read a grid and then together as a class, plot 2 squares, one yellow and one green. Then they plot the remaining squares independently and...
Curated OER
Writing A Book Review of The Hobbit
Students explore The Hobbit by J.R.R. Tolkien. In this book review instructional activity, students examine the elements included in a book review, such as author, opinions of the book, summary, character information, main points...
Curated OER
Graphing Points Worksheet
In this graphing points worksheet, learners plot ordered pairs on a coordinate plane. They graph 20 given problems, with 10 problems requiring students to graph two or more points.
Curated OER
Parts of a Story
Students read a short fiction book and demostrate comprehension by identifying the main characters, setting, conflict, theme, and summarizing the main points. They organize the information in Inspiration and create a powerpoint to show...
Curated OER
Student Heights
Students measure the heights of their fellow classmates and create a box and whisker plot to display the data. In this measurement lesson plan, students analyze the data and record results.
Curated OER
An Occurrence at Owl Creek Bridge Lesson Plan 5
Learners continue to read the story "An Occurrence at Owl Creek". In groups, they define the word foreshadowing. They identify the points in the story that they believe are the rising action, climax, falling action and resolution. They...
Curated OER
Plotting Earthquakes
In this earthquakes worksheet, students access a website to gather information about the magnitude and location of earthquakes for 5 days. Then students complete 7 short answer questions.
Curated OER
Scatterplots
In this scatterplots worksheet, students construct a scatter plot from a given data set. Students then answer 4 questions regarding the least-squares regression line and making predictions.
CK-12 Foundation
Least-Squares Regression
Residual plots let you find the perfect line of best fit. As users adjust the points on a scatter plot and a possible line of best fit, the interactive automatically changes the residual plot. This change allows them to see connections...
GeoGebra
All For One, One For All
Will someone please constrain those pets? Pupils create two constraint equations on the number of cats and dogs for a pet sitter. They choose specific points and determine whether the point satisfies one or both constraints. The...
CK-12 Foundation
Graphs in the Coordinate Plane: Functions on a Cartesian Plane
Connect the dots to graph a linear function. Young mathematicians use an interactive to first plot provided points on a coordinate plane. They connect these points with a line and then answer questions about the slope and y-intercept of...
CK-12 Foundation
Parametric Equations: Protecting the Village
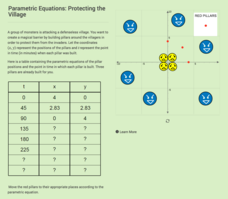
Determine the location of the pillars in time. Given a table of values for two parametric equations, pupils complete the table to determine the location and time it takes to build the pillars. Learners plot the points representing...
Radford University
How to Calculate and Analyze the Equation for a Parabolic Path
Working in groups, pupils plot three points on the coordinate plane representing three different parabolic paths. Using a calculator, they determine the quadratic regression equation for their models. Each team then figures out the...
Curated OER
Rational Functions
Through a mini assessment, high schoolers identify and list the vertical and horizontal asymptotes for the given rational functions and determine the type of asymptote of a given rational function. They also decide which form of a...
Curated OER
Graph a Picture on Cartesian Coordinates
Find out what picture is hidden in this graph and work on coordinate graphing with this worksheet! Learners plot 66 ordered pair points on a Cartesian graph, then connect the dots to make a picture. This would work as an in-class...
Curated OER
Movie Maker: Retelling a Story
Using Movie Maker, sixth graders make an eight frame movie based on a story they have written. They choose music clips, select pictures from PowerPoint, and make their movie. The lesson plan should take about ten days to complete.
Other popular searches
- Plotting Coordinates Picture
- Plotting Points Pictures
- Fun Plotting Points
- Plotting Points on Graphs
- Plotting Coordinates Maps
- Plotting Coordinates on Maps
- Plotting Points on a Graph
- Plotting Coordinates Graphs
- Plotting Points on a Grid
- Plotting Points Math
- Ell Math Plotting Points


