Curated OER
Graphing From Function Tables
In this graphing from function tables worksheet, learners graph given functions from a completed function table. This is a worksheet generator, the teacher can set the grid size for plotting points as well as whether or not to include a...
Noyce Foundation
Granny’s Balloon Trip
Take flight with a fun activity focused on graphing data on a coordinate plane. As learners study the data for Granny's hot-air balloon trip, including the time of day and the distance of the balloon from the ground, they practice...
Curated OER
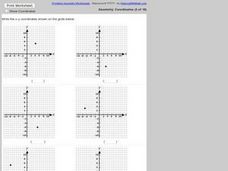
Identifying Points in the Coordinate Plane
In this ordered pairs worksheet, learners identify 6 ordered pairs given a coordinate plane. Students list the ordered pair given the graph.
Curated OER
Melissa's Garden
In this math activity, students identify the location of pictures on a coordinate plane. They write some answers as an ordered pair. They read ordered pairs and identify the picture at a specified location. Six problems are on a page. An...
Curated OER
Shape Capture Game
In this shape capture game instructional activity, 8th graders work in pairs to plot quadrilaterals, then guess ordered pairs for each other's shape in order to locate the vertices on the grid; can be used with other shape as well.
Curated OER
Using Graphs
In this using graphs instructional activity, 9th graders solve and complete 6 different types of problems. First, they determine how the transformation shown moves the graph. Then, students find the interval that is defined given the...
Curated OER
Graphing Linear Equations
In this calculator active graphing worksheet, students graph 12 equations via a calculator and transfer the graphs onto coordinate grids.
Curated OER
Plotting Points
In this middle school mathematics/Algebra I instructional activity, learners plot points on a coordinate plane. The one page instructional activity contains six problems. Answers are not provided.
EngageNY
Constant Rate
Two-variable equations can express a constant rate situation. The lesson presents several constant rate problems. Pupils use the stated constant rate to create a linear equation, find values in a table, and graph the points. The resource...
EngageNY
Multi-Step Problems in the Real World
Connect graphs, equations, and tables for real-world problems. Young mathematicians analyze relationships to identify independent and dependent variables. These identifications help create tables and graphs for each situation.
Curated OER
Introduction to functions
In this functions worksheet, students plot points on a graph according to the rule. Students plot 7 points on each of the 2 graphs given to them.
Curated OER
Graphing Points: Pre Test
In this graphing points worksheet, students complete multiple choice questions about axis's on a graph and points on a graph. Students complete 10 questions total.
Curated OER
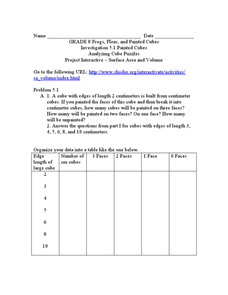
Analyzing Cubes
In this analyzing cubes worksheet, 9th graders solve and complete 6 different types of problems. First, they organize the given data into the table provided. Then, students study the patterns in the table and tell whether the pattern of...
Virginia Department of Education
Graphing Linear Equations
Combine linear equations and a little creativity to produce a work of art. Math scholars create a design as they graph a list of linear equations. Their project results in a stained glass window pattern that they color.
Curated OER
Graphing Points: Post Test
For this graphing points worksheet, students answer multiple choice questions about the points on a given graph. Students answer 10 questions total.
Curated OER
Graphing Ordered Pairs
In this math worksheet, students learn to graph ordered pairs. Students examine a graph with 3 labeled points and tell the ordered pairs for each. Students also plot 8 ordered pairs on a graph they draw themselves.
Curated OER
Graph Functions: Practice
In this graph functions worksheet, students complete several activities to help them graph functions. Students use the table and the graph to complete the questions. Students also answer two test prep questions.
Georgia Department of Education
Math Class
Young analysts use real (provided) data from a class's test scores to practice using statistical tools. Not only do learners calculate measures of center and spread (including mean, median, deviation, and IQ range), but...
Curated OER
Exponential Functions
In this algebra worksheet, learners evaluate exponential functions using tables and graphs. There are 6 questions with an answer key.
Curated OER
Linear Equations
In this algebra learning exercise, learners solve and graph linear equations. They differentiate between parallel and perpendicular lines. There are 35 questions about graphing.


