EngageNY
Graphs of Simple Nonlinear Functions
Time to move on to nonlinear functions. Scholars create input/output tables and use these to graph simple nonlinear functions. They calculate rates of change to distinguish between linear and nonlinear functions.
Virginia Department of Education
Graphing Linear Equations
Combine linear equations and a little creativity to produce a work of art. Math scholars create a design as they graph a list of linear equations. Their project results in a stained glass window pattern that they color.
Virginia Department of Education
How Much is that Tune?
Tune in for savings! Scholars investigate pricing schemes for two different online music download sites. After comparing the two, they determine the numbers of songs for which each site would be cheaper.
Curated OER
Slippery Slope
Learners define patterns, relation and function. In this algebra lesson, students find the slope of a line and write equations of line. They model the slope using real life scenarios.
Curated OER
Sloping and Intersecting a Linear Function
Students examine and discuss typical linear equations, and the difference between a linear and nonlinear equation. They observe examples of linear equations and complete a worksheet.
Curated OER
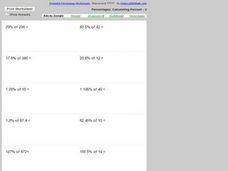
Percentages: Calculating Percent-1
In this percentages worksheet, students calculate percentages in eighteen problem solving percentage equations. Students show each step of their work.
Helping with Math
Percentages: Calculating Percent - 2
Here is a worksheet on which math classes practice calculating the percentage of different numbers. Some of the percentages involve decimals, so this would not be an assignment for first-time percent calculators! You can print the...
Pennsylvania Department of Education
The Multiplicative Identity and Numbers Close to One
Pupils practice multiplying and dividing whole numbers by fractions. They study the multiplicative identity property that states that the product of any number and 1 is that number. They multiply whole numbers by fractions close to 1 and...
Curated OER
Bungee Jump Lab
Student apply linear relationships to the real world. They use Ken and Barbie dolls and experiment to find the line of best fit. They collect data, analyze data, and make predictions from it. The students also use Microsoft Power Point...
Curated OER
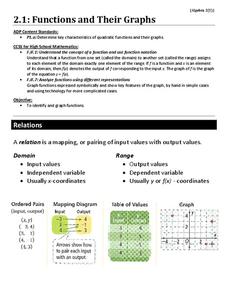
Functions and Their Graphs
Use a worksheet to go over the basic concepts of relations and functions. Included are clear definitions and examples of relations, domain and range, and functions and the vertical line test. However, the problems are pretty basic. A...
Curated OER
Graphs and Functions
Use this series of activities to introduce learners to graphing functions. They graph both linear and quadratic equations by hand and with a Graph Sketcher Tool. Several imbedded links and handouts are included in the lesson.
Pennsylvania Department of Education
Fractional Parts Using an Area Model
Learners explore multiplying fractions and their relationship to parts of a whole. They draw and shade fractional parts to show parts of a whole and fractional parts of a fraction. Pupils also use an Internet site for interactive practice.
Curated OER
Dividing with Fractions
Use paper strips or models to relate division problems to division of fraction problems. Since the materials can be broken up, it helps them to show how they can complete repeated subtraction with fractions and not just whole numbers.
Curated OER
The Trapping of Trapezoids
This is a nice hands-on activity where young geometers create trapezoids and calculate their area by looking at areas of quadrilaterals and triangles.
Curated OER
Three Methods for Using Quadratic Functions to Model Data
In this modeling data worksheet, students use quadratic functions to model data using three different methods. This worksheet provides explanations and an example. Additionally, students are given the steps to find the maximum or...
Curated OER
The Sum of Our Integer Intelligences
Students complete tasks. In this Seven Intelligences lesson, students complete a variety of activities that are all based on the seven different intelligences humans are supposed to possess based on Dr. Gardener's theory. They work in...
Curated OER
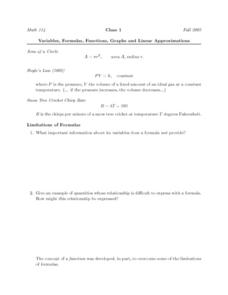
Variables, Formulas, Functions, Graphs and Linear Approximations
In this limitations of formulas worksheet, students answer four essay questions about functions. Two questions refer to the limitations of formulas. They graph one function and explain how it specifies the rule of the function.
Curated OER
Fractions and Ribbons
Sixth graders explore using inverse operations to solve decimal and fraction problems. In this decimal and fraction instructional activity, 6th graders prepare ribbon for a part and need to cut it in equal lengths. Students analyze the...
Curated OER
Percentages: Decimals To Percent
In this percentages activity, students write twelve decimals as percentages and twelve percentages as decimals. Students check their answers with the key when they are finished.
Curated OER
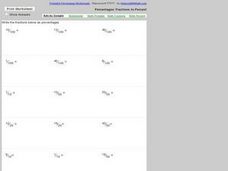
Percentages: Fractions To Percent
In this percentages worksheet, students write eighteen fractions as percentages. Students problem solve each fraction as a percentage.
Curated OER
Graphing Points: Post Test
In this graphing points worksheet, students answer multiple choice questions about the points on a given graph. Students answer 10 questions total.
Curated OER
Graphing Points: Pre Test
In this graphing points worksheet, students complete multiple choice questions about axis's on a graph and points on a graph. Students complete 10 questions total.
Curated OER
Discovering the Linear Relationship between Celsius and Fahrenheit
Pupils discover the linear relationship between degrees Farenheit and degrees Celsius. They manually compute the slope and y-intercept of the line passing through points. They convert Celsius to Fahrenheit degrees.
Curated OER
Spaghetti Bridges
Students thread a piece of spaghetti through the holes in the cup. One person suspend the cup by placing each index finger approximately one inch in from the ends of the spaghetti.


