Shmoop
ELA.CCSS.ELA-Literacy.RL.9-10.3
Focus on complex characters with a lesson from a series that teaches individual skills from the Common Core. Specifically, this resource provides practice with standard RL.9-10.3. Get pupils thinking and talking about characters with the...
Shmoop
ELA.CCSS.ELA-Literacy.RL.9-10.9
As the saying goes: there are no new stories. Standard 9 for reading literature in the Common Core addresses this fact and requires that students be able to analyze how authors use the themes, stories, and characters of earlier works....
It's About Time
Mass Extinction and Fossil Records
The focus of a fossil-based lesson uses graphs and charts that allow young paleontologists to make inferences about events of mass extinction. They must apply their previous knowledge about fossil records in this final lesson of the...
EngageNY
Measuring Variability for Symmetrical Distributions
How do we measure the deviation of data points from the mean? An enriching activity walks your class through the steps to calculate the standard deviation. Guiding questions connect the steps to the context, so the process is not about...
EngageNY
Sampling Variability
Work it out — find the average time clients spend at a gym. Pupils use a table of random digits to collect a sample of times fitness buffs are working out. The scholars use their random sample to calculate an estimate of the mean of the...
EngageNY
The Mean Absolute Deviation (MAD)
Is there a way to measure variability? The ninth resource in a series of 22 introduces mean absolute deviation, a measure of variability. Pupils learn how to determine the measure based upon its name, then they use the mean absolute...
West Contra Costa Unified School District
Solving Inequalities
What does translating points on a number line have to do with solving inequalities? Young mathematicians first learn about translations of points on a number line, and then use this information to solve linear inequalities in one variable.
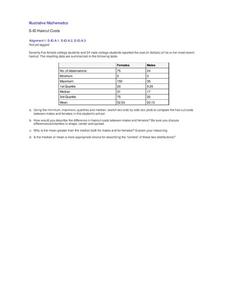
Illustrative Mathematics
Haircut Costs
Who pays more for haircuts, men or women? Given quartile values, learners construct box and whiskers plots and interpret the results. They compare the mean and median, and discuss which is more appropriate under particular conditions....
Shmoop
ELA.CCSS.ELA-Literacy.RL.11-12.2
There is nothing more frustrating than discussing theme in literature, and now the Common Core requires that your learners determine two or more, and discuss the development of it throughout the text. This is crazy, but manageable with...
Virginia Department of Education
Exploring Statistics
Collect and analyze data to find out something interesting about classmates. Groups devise a statistical question and collect data from their group members. Individuals then create a display of their data and calculate descriptive...
Curated OER
Strike a Pose: Modeling in the Real World (There's Nothing to It!)
Adjust this lesson to fit either beginning or more advanced learners. Build a scatter plot, determine appropriate model (linear, quadratic, exponential), and then extend to evaluate the model with residuals. This problem uses real-world...
Curated OER
Identify the Mood
For this reading worksheet, students identify the mood of a book, story, song, movie, TV show, or play. Students record words and phrases about the characters, setting, and plot. Students also describe their resulting feelings and thoughts.
Cheetah Outreach
Life Cycles
How does a cheetah life cycle differ from a human life cycle? Kids graph weight gain for humans versus cheetahs and compare other life cycle events such as gestation and life span
It's About Time
The Sun and Its Effects on Your Community
Why is the sun round? Examine this question, and others, with your pupils while teaching them how to live in a more earth-friendly environment. Pupils explore Sun composition and discuss how solar wind, sunspots, and solar energy affects...
Statistics Education Web
Population Parameter with M-and-M's
Manufacturers' claims may or may not be accurate, so proceed with caution. Here pupils use statistics to investigate the M&M's company's claim about the percentage of each color of candy in their packaging. Through the activity,...
Noyce Foundation
Granny’s Balloon Trip
Take flight with a fun activity focused on graphing data on a coordinate plane. As learners study the data for Granny's hot-air balloon trip, including the time of day and the distance of the balloon from the ground, they practice...
It's About Time
How Do Carbon Dioxide Concentrations in the Atmosphere Affect Global Climate?
Does carbon dioxide really affect temperatures across the world? This fifth installment in a six-part series investigates the relationship between carbon dioxide and global temperatures. Graphs created from genuine data help young...
Statistics Education Web
Did I Trap the Median?
One of the key questions in statistics is whether the results are good enough. Use an activity to help pupils understand the importance of sample size and the effect it has on variability. Groups collect their own sample data and compare...
Curated OER
Statistical Diagrams
In this statistics worksheet, students explore five activities that require analysis and interpretation of maps, charts, and scatter plots. The six page lesson includes five activities or experiments with short answer questions. ...
EngageNY
Estimating Centers and Interpreting the Mean as a Balance Point
How do you balance a set of data? Using a ruler and some coins, learners determine whether the balance point is always in the middle. Through class and small group discussions, they find that the mean is the the best estimate of the...
Curated OER
Making A Story Map
Sixth graders learn to plan a story by using a story map. They analyze a detailed sample story map and answer 5 questions about it. Then, plan their own story using a story map template.
Curated OER
Making Money and Spreading the Flu!
Paper folding, flu spreading in a school, bacteria growth, and continuously compounded interest all provide excellent models to study exponential functions. This is a comprehensive resource that looks at many different aspects of these...
Teach Engineering
Can You Resist This?
Some things are hard to resist. Small collaborative groups build circuits and calculate the voltage using Ohm's Law. Budding engineers explore the connection between the voltage across different resistors and linear functions with...
Curated OER
Poetry Appreciation – "The Raven"
Introduce your class to "The Raven" by Edgar Allan Poe with this series of activities, exercises, and worksheets. Class members examine an image, analyze a movie trailer, read a prose version of the poem, look up vocabulary, and pick out...


