Curated OER
Tension Between Conflict and Compromise
Learners prepare for and participate in a debate and mock trial regarding laws broken during the Boston Tea Party. Several primary documents and a homework chart are included.
Curated OER
Chart the Stars
Seventh graders find constellation distances and plot the stars. In this star lesson, 7th graders plot the star points for Canis Major. Students use graphing calculators to graph the constellation. Students choose another constellation...
Curated OER
What is a Box and Whisker Plot?
Eighth graders explore the correct use of box and whisker plors. The times when they are appropriate to use to compare data is covered. They plot data according to statistical analysis including mean, median, and mode.
Curated OER
Area Investigation
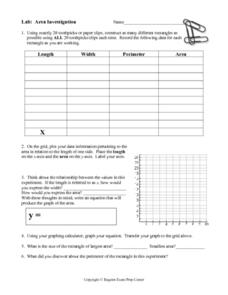
In this area investigation activity, 8th graders solve and complete 6 different problems that include complete a chart with given data and a graph. First, they construct as many different rectangles as possible using toothpicks. Then...
Curated OER
Problems and Their Solutions in Stories and Everyday Life
Students identify story elements. In this stories lesson, students read a story and identify the chracter, character traits, plot, setting and theme. Groups of students match problem and solution cards.
Curated OER
It's in the Elements - Lesson Four
Young scholars compare and contrast story elements in two versions of Cinderella. In this literature elements lesson plan, students are read two different versions of Cinderella, they identify the characters, plot, and setting, then...
Virginia Department of Education
Graphs
Examine different types of graphs as a means for analyzing data. Math scholars identify the type of graph from a series of data displays and then develop questions to match each one. Then, given a scatter plot of height versus age data,...
Curated OER
A Picture Says a Thousand Words
Use photographs to trigger memories. Writers use a personal photograph as a starting point for an autobiographical writing exercise. They complete brainstorming activities that have them study their photograph before actually putting pen...
Virginia Department of Education
What's the Point?
Point your class in the right direction in plotting points with three activities that give scholars a chance to learn about and practice plotting points on a coordinate plane. They draw figures on the coordinate plane and list out the...
Balanced Assessment
A Fishy Story
There's nothing fishy about this resource. In the task, learners use given information about fish prices to create a scatter plot and line of best-fit. Later, they use the information to answer questions about the profit from fish sales.
Beyond Benign
Can You Hear Me Now? Cell Phone Accounts
How sustainable are cell phones? Throughout the unit, learners explore the issues around cell phones concerning sustainability. Class members take a graphical look at the number of cell phones across the world using a box-and-whisker...
Stillwater Central School District
The Adventures… Of Alice in Wonderland
Go down the rabbit hole with a thorough novel unit for Lewis Carroll's Alice in Wonderland. With a cause and effect chart, K-W-L organizer, and reading comprehension questions, the resource is a great addition to your summer assignments...
EngageNY
End-of-Module Assessment Task - Algebra 1 (Module 2)
Check for understanding at the end of your descriptive statistics unit with an end-of-module assessment. It uses five questions to measure progress toward mastery of descriptive statistics standards. Each question is developed to address...
Curated OER
Lively Read of the Tale of Despereaux
Students create a character map of the main characters in The Tale of Despereaux. After reading the text, students create a character chart based on information they gleaned from the story. They use this information to write a letter...
Curated OER
Five Elements of a Story
Here’s a graphic organizer that permits learners to chart the introduction, rising action, climax, falling action and resolution of a story. The PDF file can be customized to work with any narrataive.
Do2Learn
Sequencing Chart
Take note of events in a story with this organizer. Learners write down the who, what, where, and when, writing down four events in the order that they occur.
Curated OER
Using Plot Elements to Retell a Story
Sixth graders chart a story. In this plot elements lesson students chart and then retell a story from the rising action until the resolution. Students use stories from the book America Street.
Curated OER
Lilly's Purple Plastic Purse: Kevin Henkes
Kevin Henkes has composed a series of books in which Lilly the mouse is a main character. Third graders use illustrations and key details as they compare and contrast the books, Lilly's Purple Plastic Purse and another story staring the...
Curated OER
Compare and Contrast Two Settings in One Text
Look for the signal words! Scholars get both instruction and practice comparing and contrasting. Although it is completely scripted, it can also serve as a detailed outline. Demonstrate this as you read a passage (included) and search...
Balanced Assessment
Oil Consumption
An assessment presents a chart displaying oil consumption Pupils use the chart to determine the greatest increase in consumption, and then apply that information to figure out when the consumption may reach 100 million barrels a day.
Curated OER
The Outsiders Study Guide
Provide this packet for your pupils as they pour over The Outsiders by S.E. Hinton. The study guide includes graphic organziers and comprehension as well as higher-level questions. Class members briefly summarize each chapter, compare...
Newspaper in Education
The Iliad: A Young Reader Adventure
Is The Iliad part of your curriculum? Check out a resource that offers something for those new to teaching the classic and those with lots of experience using Homer's epic. Plot summaries, discussion questions, activities abound in this...
Newspaper Association of America
Celebrating Women’s History Month
Examine the lives of four women—Blanche Stuart Scott, Madeleine L'Engle, Margaret Evans Price, and Sybil Ludington—in a 23-page activity packet. Each profile comes with a set of vocabulary and reading comprehension questions. Further...
Mathed Up!
Frequency Polygons
Frequency polygons are a different way to represent frequencies over intervals. Pupils take frequencies for intervals of data from a frequency table and plot them as a frequency polygon. Budding mathematicians find information about the...
Other popular searches
- Plot Charts
- Character/plot Chart
- Story Elements Plot Chart
- Reading Plot Chart
- Literature Plot Charts
- Story Plot Charts
- Liter Art Plot Charts
- Plot Charts for Reading
- Plot Charts for Literature
- Literart Plot Charts
- Literary Plot Charts
- Plot Charts Christmas


