Los Angeles County Office of Education
Assessment for the California Mathematics Standards Grade 5
Test young mathematicians' knowledge with an assessment aligned to California's fifth grade state standards. The exam covers a multitude of concepts including fractions and decimals, positive and negative numbers, measurement; and how to...
Curated OER
Quarter, Nickel, Dime....
An engaging game called, "Quarter, Nickel, and Dime" is presented in this math lesson. Players are given an envelope with slips of paper that represent the three coins. In pairs, they play the game 18 times, and the whole class charts...
Curated OER
It's Close Enough: Rounding and Estimation
Second graders round to the closest five, ten, and hundred. They use place-value concepts of grouping based upon powers of ten (thousandths, hundredths, tenths, ones, tens, hundreds, thousands) within the decimal number system.
Curated OER
Global Statistics
Students select appropriate data to determine the mean, median, mode and range of a set of data. They calculate the statistical data on literacy rates and life expectancy within each geographic region of the world. Students determine...
Curated OER
Study Buddies: Adding Two-Digit Numbers
Some times a simple lesson plan is all you need. Here are 2 worksheets that can be used as a lesson plan on problem solving, addition, and partner work. The first worksheet has learners use a tens and ones charts to practice adding...
Curated OER
Finding Sums to 6
Students explore the additive identity property where they add multiple numbers to get to the number 6. In this number 6 lesson plan, students also work on their addition charts.
Math Worksheets 4 Kids
Fractions into Decimal and Percent
Why was the fraction skeptical about marrying the decimal? Because he would have to convert! This worksheet provides much needed practice for young mathematicians to convert fractions into decimals and percents.
Curated OER
Global Statistics
Students determine statistics based on data. In this statistics lesson, students use data and record in charts. Students create graphs based on the statistics found.
Curated OER
I Am Golden
Students become familiar with patterns, the Fibonacci Sequence, and the Golden Ratio. They see how many places these occur. They have practical applications for using the calculator and making charts to extend patterns.
Curated OER
My Test Book: Standard Form and Reading Tables
For this math skills worksheet, learners solve 10 multiple choice math problems that require them to write numbers in standard form and read tables. Students may view the correct answers.
Charleston School District
Graphing Functions
How do letters and numbers create a picture? Scholars learn to create input/output tables to graph functions. They graph both linear and nonlinear functions by creating tables and plotting points.
Curated OER
Skip-Counting
In this skip counting math practice worksheet, students complete 2 charts that are missing numbers. Each chart includes numbers from 1-100. Students also highlight even and odd numbers.
Curated OER
Color Me Green If I Am a Five
First graders count by 5's to 100. They use a number chart to identify and mark all numbers ending in five or zero. They use the charts to participate in choral counting.
Curated OER
Chart This!
Students collect data and graph or chart the information. In this data organization lesson, students poll their classmates about certain topics and chart or graph the information to show the results of their research.
Curated OER
Mileage Charts
In this mileage chart worksheet, students solve 40 problems in which mileage from one location to another is calculated. This is an online activity that can be done on paper.
Curated OER
Atlatl Lessons for Grade 4
Fourth graders explore the weapons of the Aboriginal people. In this fourth grade math lesson, 4th graders create charts, tables, or diagrams to represent patterns and relations. Students investigate which dart length has the best...
Curated OER
French Fry Run
Student explore estimation and measurement. In this measurement instructional activity, 2nd graders measure french fries, graph their data, and determine the size of french fries that is the best value. Students practice how to add...
Curated OER
Analyzing Health
Third graders analyze their health. In this analysis lesson plan, 3rd graders rate their health on a 1-10 scale. They then tally the scores from the class and create a data chart. Then they answer true and false questions based on...
Curated OER
Cuisenaire Chefs
Students study the fractional values of Cuisenaire rods while working with favorite family recipes.
Curated OER
Finding Addition Patterns
Students practice finding the sums of two-one digit numbers. In this addition lesson plan, students also record facts onto an addition chart.
Curated OER
Probability or Ability?
Students toss candy and coins using their non-dominant hand while their partners records the results on a probability charts.
Curated OER
Graphing Data on Ellis Island
Third graders use data to make a bar graph. In this graphing and social studies lesson, 3rd graders use data about where Ellis Island immigrants came from to complete a bar graph on Microsoft Excel.
Curated OER
The Abacus
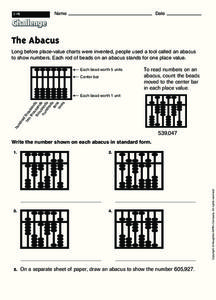
The class reads an explanation of the how the ancient calculation tool, the abacus, works. They examine four abacus images and record the number shown on each of them.
Curated OER
Hey, Pythagoras! Help Me Understand Your Theorem!
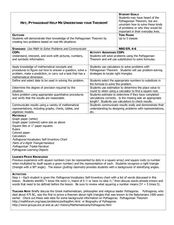
Learners explore the Pythagorean Theorem. In this math lesson plan, pupils solve problems using the Pythagorean Theorem. They select the appropriate numbers to substitute in the formula to solve problems.


