Math Moves U
Collecting and Working with Data
Add to your collection of math resources with this extensive series of data analysis worksheets. Whether your teaching how to use frequency tables and tally charts to collect and organize data, or introducing young...
Yummy Math
US Holiday Candy Sales
Candy is a big business! Calculate the amount of money consumers spent on major holidays—Easter, Halloween, Christmas, Hanukkah, and Valentine's Day—based on the total amount of candy sales from 2011 and the percentage of each holiday's...
Curated OER
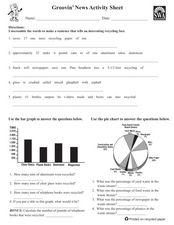
Groovin' News Activity Sheet
In these recycling worksheets, students complete several activities to learn about recycling. Students complete a word search, word scramble, bar graph, pie chart, research project, class project, and individual project for recycling.
K12 Reader
Displaying Data
It's important to learn how to display data to make the information easier for people to understand. A reading activity prompts kids to use context clues to answer five comprehension questions after reading several paragraphs about...
Curated OER
Jim, Tony, and Frank-The School Fund-raiser (Graphing)
In this graphing worksheet, students view a pie chart. Students use their graphing knowledge to interpret the pie chart and answer ten questions. There is an answer sheet.
Curated OER
Pie Chart
In this literacy worksheet, students use the created resources for further progress towards knowledge. The sheet is a teacher's guide for creating student resources.
Curated OER
Fill in the Graphs
In this graphing information activity worksheet, students use the 6 provided clues to appropriately fill in the blanks in a pie chart.
Balanced Assessment
Cost of Living
Math scholars investigate the cost of living in Hong Kong compared to Chicago but must first convert the different types of currency. They then choose a type of graph to compare different spending categories and finish the activity by...
Curated OER
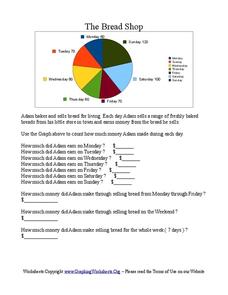
The Bread Shop
In this pie chart activity, students use the pie chart graph to count the money Adam made in the Bread Shop. Students complete 10 questions.
Beyond Benign
Plastic Bags
Paper or plastic? Explore the environmental effects of using plastic bags through mathematics. Learners manipulate worldwide data on plastic bag consumption to draw conclusions.
Virginia Department of Education
Graphs
Examine different types of graphs as a means for analyzing data. Math scholars identify the type of graph from a series of data displays and then develop questions to match each one. Then, given a scatter plot of height versus age...
Curated OER
Cindy and Linda - Selling Lemonade
In this pie charts worksheet, students use the pie chart to count how many glasses of Lemonade were sold by Cindy and Linda. Students complete the table and answer 3 questions.
Curated OER
Sunspot Activity
In this sunspot activity worksheet, students are given a table with 3 types of flares produced by sunspots based on their brightness. Students answer 5 questions by interpreting the data and they determine the percentages of the...
Curated OER
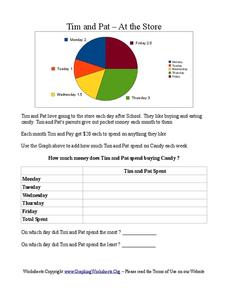
Tim and Pat - At the Store
For this pie chart worksheet, students use the pie chart to add the amount of time Tim and Pat spend buying candy each day of the week. Students answer 2 questions about the table.
Curated OER
Recycling Statistics
In this environment activity, students look for the answers to the environmental impact of recycling in Great Britain with the statistics from the pie graph.
Curated OER
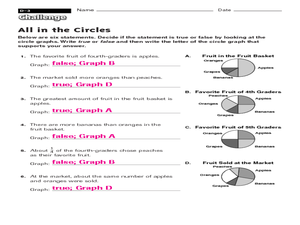
All in the Circles
In this circles worksheet, students use 4 circle/pie chart graphs to answer a set of 6 questions. Answers are included on page 2.
Curated OER
A Thanksgiving Story
For this active and passive voice worksheet, middle schoolers read a paragraph regarding Thanksgiving and then rewrite five of the sentences in passive voice.
Curated OER
Data Collection and Presentation
Middle and high schoolers collect and analyze data from four different activities. The activities include information about classmates, tallying colors of cars in a parking lot, stem and leaf plots, and making a histogram from...
Curated OER
Day Circle
In this daily activities instructional activity, students use the hour pie chart to help them write down 6 things they do and at what time they do them. Students fill in the pie chart for the hours they complete the activities.
Curated OER
Data Handling
In this data handling worksheet, students explore multiple ways to represent data. They create stem and leaf plots, histograms, and bar charts. Students examine and interpret diagrams and statistics. This eleven-page...
Curated OER
Completing Frequency Diagrams from Displayed Data
In this frequency diagram worksheet, students use a bar chart, stacked bar chart and pie chart to complete frequency tables. A reference web site is given for additional activities.
Curated OER
Fraction Circles
In this fraction circles worksheet, students examine 4 fractions circles separated into pie-shaped fraction tenths. The unlabeled charts can be used in a variety of classroom activities.
Curated OER
Garfield and Friends
In this Garfield learning exercise, students watch a video about Garfield and answer true and false, multiple choice, and crossword questions about it. Students complete 3 activities total.
Curated OER
Mission 5: Energy and the Environment
In these energy and environment worksheets, students learn about energy sources and the role they have with the environment. Students complete an 18 page packet for the activity.


