Cornell University
Math Is Malleable?
Learn about polymers while playing with shrinky dinks. Young scholars create a shrinky dink design, bake it, and then record the area, volume, and thickness over time. They model the data using a graph and highlight the key features of...
Curated OER
Linkages Between Surface Temperature and Tropospheric Ozone
Young scholars use data microsets of mean near-surface air temperature and tropospheric ozone residual averages to infer patterns. Students analyze changes in tropospheric ozone and then hypothesize about the consequences of these changes.
Curated OER
Water Cycle
Identify and interpret the earth's different water sources. Third and fourth graders describe and demonstrate the process of the water cycle, make a model of its two main parts, and predict and infer to answer questions about the...
Mascil Project
Epidemics: Modelling with Mathematics
The Black Death epidemic is responsible for more than one million deaths in the United Kingdom. An inquiry-based activity has young scholars explore the rate of disease spread. They then analyze graphs showing data from epidemics such as...
Curated OER
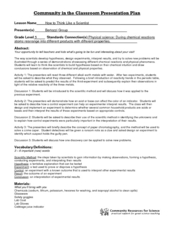
How to Think Like a Scientist
Fifth graders study the scientific method and understand how to apply it. In this "thinking like a scientist" lesson students complete several activities.
Curated OER
Munching Mice
Students examine different variables and their effects on weight gain in mice. They consider the validity of relating the results in mice to humans.Finally, they discuss the ethics of using animals in experiments.
Curated OER
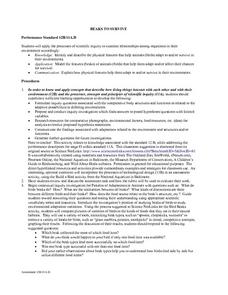
Beaks To Survive
Pupils discuss and identify the types of adaptations that are made by different organisms in order for them to survive. In groups, they describe the features of beaks and discuss how it affects their chances for survival. They share...
Curated OER
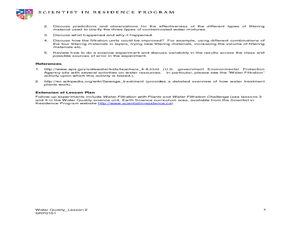
Water Quality: Water Filtration
Students build a water filtration system. For this water quality lesson, students work in groups to construct water filtration units that can purify contaminated water. This lesson is part of a larger unit on water quality.
Curated OER
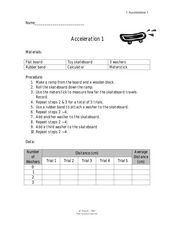
Acceleration 1
In this acceleration worksheet, students use weights to increase the mass affecting the force on moving objects. Students plot a graph of their data and answer 3 questions about how the acceleration of the toy skateboard used in the...
Curated OER
Experimenting With Motion
In this motion worksheet, students design an experiment to investigate motion. They form a question, they develop a hypothesis, they design an experiment and then answer 4 questions about their experiment.
Curated OER
Moving Bodies
In this moving bodies worksheet, students investigate how the amount of mass of a body in motion affects its tendency to remain in motion. Students use a meter stick as a ramp, marbles, string and a wooden block to determine how far a...
Curated OER
Catapults
Students test catapults. In this physics lesson, student conduct scientific investigations that require them to test catapults. Students practice their problem solving skills as they employ the use of the scientific method.
Curated OER
Slingshot Characterization Experiment
Students set up and conduct a scientific experiment to demonstrate data collection. In this scientific process lesson, students complete an activity with the specific objective of using a slingshot to fire a t-shirt into the crowd at a...
Curated OER
Pendulum Lab
Learners predict how changing the pendulum components affect its period. In this physics instructional activity, students calculate the period using different masses. They analyze lab result and complete assigned worksheet.
Curated OER
Volumw Measurement, English System
Eighth graders biew each volume container and discuss where they have seen them in their home, and how they have seen them used. They explore the different names of volume sizes and their equivalents towards one another. Students...
Curated OER
Using Graphs to Compare
Pupils use the FoilSim computer simulation program, and demonstrate an understanding of the lift variables by explaining their graphical representations. They demonstrate an understanding of forces and motion.
Curated OER
Solar
Students study solar energy. In this renewable energy lesson students complete several lab activities using different controls and variables.
Curated OER
Determining the Relationship Between pH and Hydrogen Ions with Microcomputer Based Lab (MBL) and/or Calculator Based Lab (CBL) Equipment
Learners find the relationship between the variables based on experimental data. They determine mathematical relationship between pH and the amount of hydrogen Ions in solution.
Discovery Education
Cushion It!
Sugar cubes, collide! Groups design protection systems using bubble wrap to protect sugar cubes from being destroyed by falling batteries in the STEM lesson plan. They consider how the experiment relates to collisions in real-world...
Curated OER
Ohm's Law
If your future physicists know how to construct simple circuits, include resistors, and use a multi-meter to measure voltage, then you might employ this lesson on Ohm's law. Each lab group investigates the relationships among...
Curated OER
The Effects of Photosynthesis on Plant Growth
Young scholars examine the process of photosynthesis; its products and reactants, and the sequence of the process. They diagram the light reactions, record observations of plants, and discuss how difficult it is to measure plant growth...
Curated OER
"Investigating Soil Color and Texture"
Ninth graders will identify/understand the differences between soil and dirt. They will classify soil color accurately and use Munsell notation to describe it (Munsell books provided).Students will classify soil texture using the feel...
Curated OER
Marine Animals on the Move
Young scholars work with partners to track tagged animals using real-time data from satellites. Students gather and analyze data, compile information and conclusions and then prepare a final presentation of their research.
Curated OER
Lesson 2 - Design Process-Measuring Wind Speed
A terrific lesson focused on the design process. It begins with a presentation, "Design: Solve a Problem," which lists the steps of the process and then introduces the specific challenge: to build a device that measures wind speed....


